According to the most recent government figures, there are approximately 5.7 million private sector businesses in the UK. Our estimates suggest that 288,018 of these (roughly 5%) went bust in 2025.
Yet only 1.5% of business owners surveyed by BICS felt their company was at severe risk of insolvency, highlighting a slight disconnect between the perceived and actual insolvency risk for UK corporations.
With this in mind, The Liquidation Centre has compiled the latest statistics on business failure for 2026, including the percentage of startups that fail, insolvency rates across the UK, and the most common reasons for businesses going bust.
Our report on business failure statistics combines historical data on the UK-s business failure rate to project how company insolvency statistics could change in the future and what this could mean for enterprises of all sizes across the country.
Disclaimer: Business failure statistics are accurate as of the time of writing. There may be some variation in reported figures depending on the source(s) used. Where possible, the most recent data has been selected from the most authoritative sources available. In some cases, multiple datasets have been included to illustrate variation in reported figures.
Top 10 Must-Know Business Failure Stats 2026
- Most UK business closures occur in Q1 of each year, averaging 90,911 between 2017 and 2025. (Source: The Liquidation Centre via IDBR)
- Up to 289,000 UK businesses could fail in 2026. (Source: The Liquidation Centre via ONS)
- The West Midlands saw the highest rate of change in business failures, rising by 41.79% between 2017 and 2025. (Source: The Liquidation Centre via ONS)
- Up to 43,000 UK construction companies could fold in 2026, more than any other industry. (Source: The Liquidation Centre via ONS)
- Business failures in the agriculture, forestry, and fishing industry increased by 86.46% from 2017 to 2025, the largest across all sectors. (Source: The Liquidation Centre via ONS)
- There could be up to 25,000 insolvencies in the UK in 2026, with less than half of these being startups. (Source: The Liquidation Centre via The Insolvency House and Companies House)
- Most UK startups survive the first year, but half will fail by the third. (Source: The Liquidation Centre via ONS)
- 14.3% of UK transport and storage companies fail in their first year. This jumps to an average of 50.4% for the second year and 70.9% for the third. (Source: The Liquidation Centre via ONS)
- Norwich had the highest liquidation rate of all UK towns and cities analysed in 2025. (Source: The Liquidation Centre via Free Company Data)
- Just 1.5% of UK business owners surveyed felt that their company was at a severe risk of insolvency. (Source: BICS)
UK business failure statistics
UK business failure rate
220,490 businesses across the UK folded in the year leading up to Q3 2025. This was marginally down on the same time 12 months earlier (227,605) and represented a drop of almost a quarter (24.6%) from a peak of 292,420 for Q1-Q3 2022.
The number of UK businesses removed from the IDBR over time (2017-25)
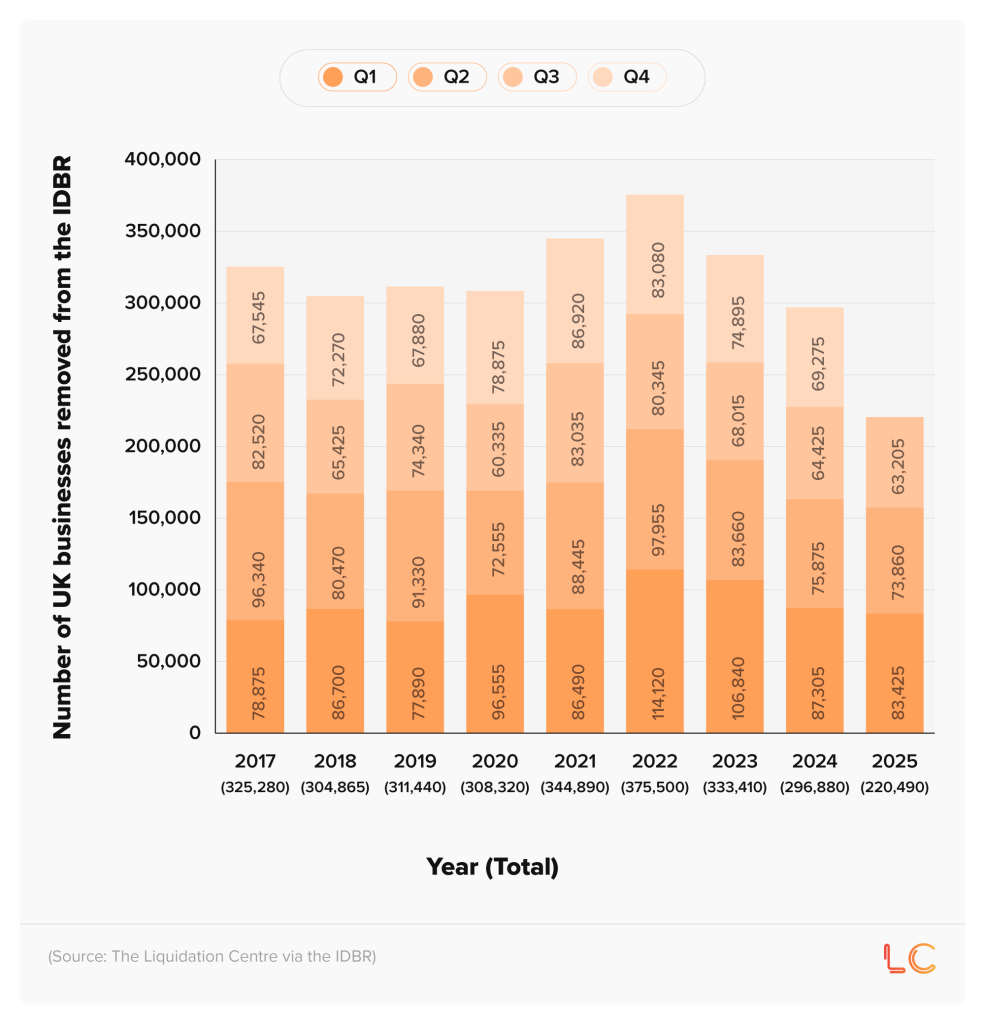
296,880 UK companies shut down in 2024, according to recent business failure statistics from the Inter-Departmental Business Register (IDBR). This was the only year since 2017 in which this figure dropped below 300,000, representing a 20.9% decrease from the 2022 high of 375,500 business closures.
Average number of business closures in the UK per quarter (2017-25)
| Quarter | Average no. of UK business closures |
|---|---|
| Q1 | 90,911 |
| Q2 | 84,499 |
| Q3 | 71,294 |
| Q4 | 75,093 |
(Source: The Liquidation Centre via the IDBR)
The majority of UK business closures occur in the first quarter of the year, with an average of 90,911 in Q1 across 2017-25. This figure tends to drop throughout the year, reaching around 71,294 in Q3, before rising again in the final quarter.
Percentage of businesses that fail in the UK
According to business failure statistics from the IDBR, there were 280,000 business deaths in the UK in 2024, resulting in a business death rate of 9.8%.This represents a year-on-year (YoY) decline since 2022 in the number of businesses that cease to exist, with figures standing at 345,000 and 11.9%, respectively.
UK business birth and death rates over time (2019-24)
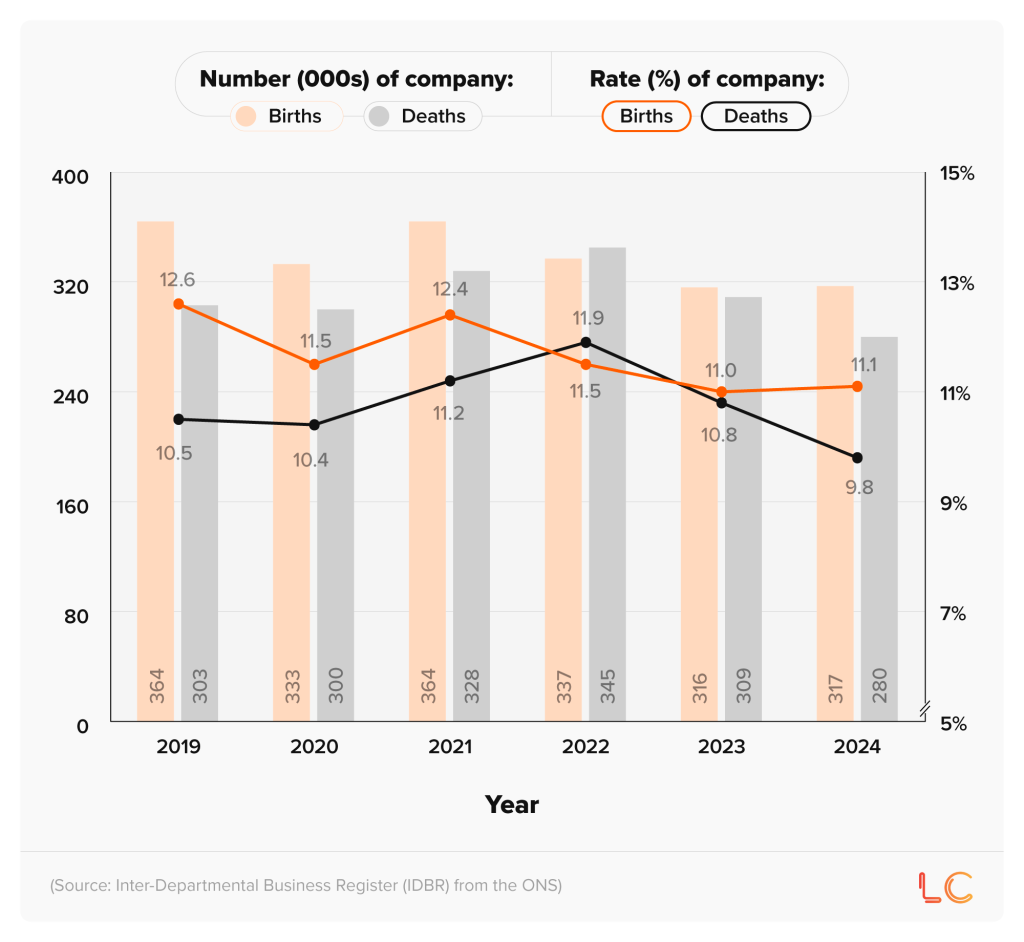
The number of UK businesses that closed down fluctuated between 300,000 in 2020 and 328,000 in 2021. This caused the UK business death rate to rise from 10.4% to 11.2% within 12 months.
The number of failed UK businesses by area over time (2019-28)
According to recent business failure statistics from the ONS:
- 296,885 UK businesses failed in 2024. This represented a 20.9% decrease from the 2022 peak of 375,550. Should current trends continue, our forecasts suggest that the number of business closures could drop to 286,802 (a 3.4% decline over four years).
- 58,895 UK businesses (19.8%) that failed in 2024 were based in London. This was more than double the number of companies that closed in the East of England during the same year.
Northern Ireland and the North East of England saw the fewest company closures in 2024, at 6,115 and 8,315, respectively. This accounted for 2.1% and 2.8% of UK business failures in the year.
The percentage of UK business failures by country over time (2019-24)
| Country | 2019 | 2020 | 2021 | 2022 | 2023 | 2024 |
|---|---|---|---|---|---|---|
| UK | 10.5% | 11.5% | 12.4% | 11.5% | 11.0% | 11.1% |
| England | 12.8% | 11.7% | 12.5% | 11.6% | 11.1% | 11.2% |
| Wales | 11.6% | 11.2% | 13.2% | 11.6% | 10.3% | 10.1% |
| Scotland | 11.6% | 9.5% | 10.7% | 10.8% | 10.6% | 10.7% |
| Northern Ireland | 9.8% | 9.1% | 10.3% | 8.3% | 8.3% | 9.5% |
Approximately 11.1% of UK businesses failed in 2024. This figure was slightly higher in England (11.2%), but dropped for other regions of the UK, down to a low of 9.5% in Northern Ireland.
The rate of business failure in the UK has fluctuated from a low of 10.5% in 2019 to a high of 12.4% in 2021. Wales experienced the country-s highest recorded death rate for businesses in 2021 (13.2%). This is contrasted with the lowest reported figure of 8.3% in 2022 and 2023 for Northern Ireland.
Percentage change of UK business failure statistics by area over time (2017-25)
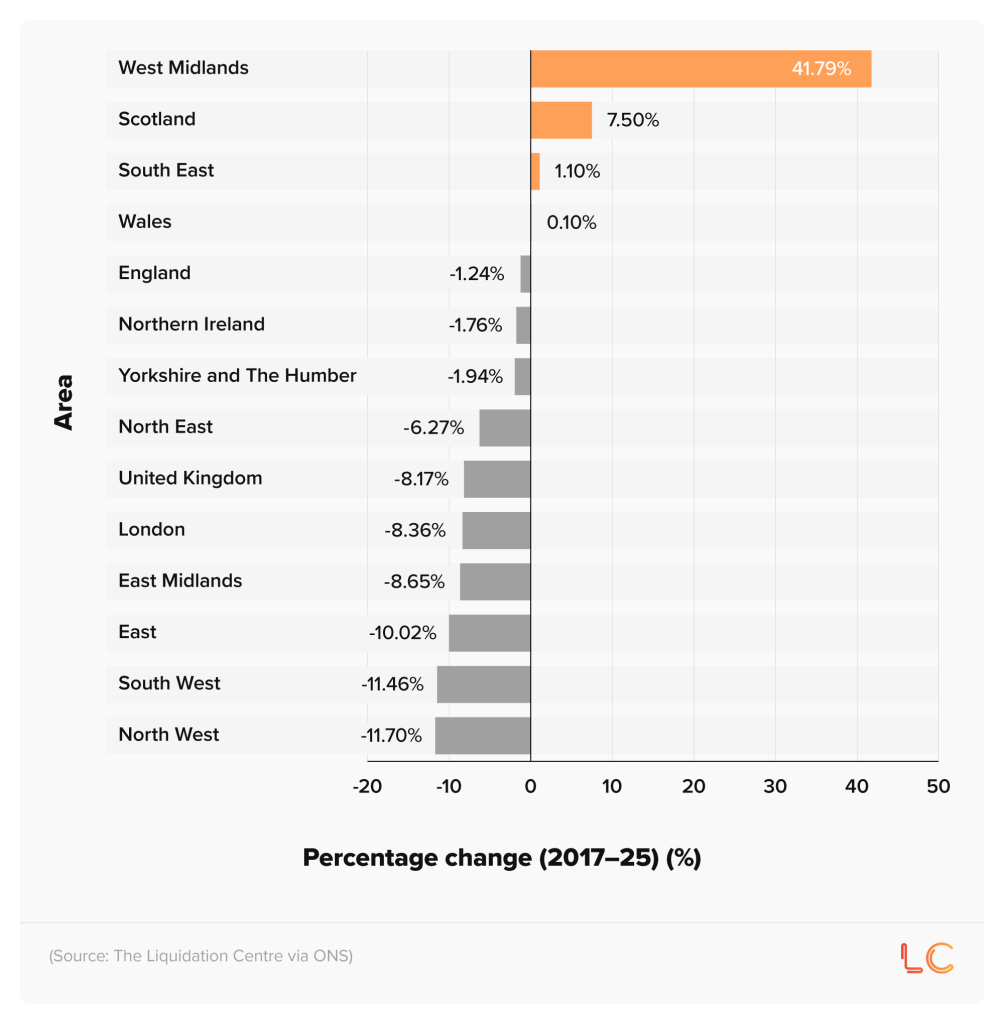
The West Midlands was the leading region of UK business failures between 2017 and 2025, with 41.79% of businesses failing.
This was followed by a 7.5% increase in the number of businesses that closed in Scotland between 2017 and 2025.
Nine of the 13 areas of the UK experienced a negative percentage change in the number of businesses that failed, with the greatest decrease happening in the South West (-11.46%) and the North West (-11.7%) of England.
Average number of quarterly business closures in the UK by area over time (2017-25)
Between 2017 and 2025, Q1 had the highest average number of business closures across the UK, with more than 85% of them in England.
Of these 77,917 closures, 24% were situated in London, with around a sixth (15.9%) based in the South East.
Richard Hunt, Insolvency Practitioner at Liquidation Centre, said:
"Business closures tend to peak in Q1 because many firms review their performance from the previous year and decide whether they can realistically continue before taking on another year of costs such as rent, tax bills and insurance. This makes the start of the year a common point for winding down operations, especially after a quieter winter trading period.
London and the South East record higher closure volumes simply because they have the largest number of businesses and the highest operating costs, so pressures show up more strongly there.
As the year progresses, closure numbers usually fall because trading conditions improve in spring and summer, and the businesses that remain are generally more stable and better able to manage their ongoing costs.?
Percentage change in UK business closures by area over time (Q1 2017-Q3 2025)
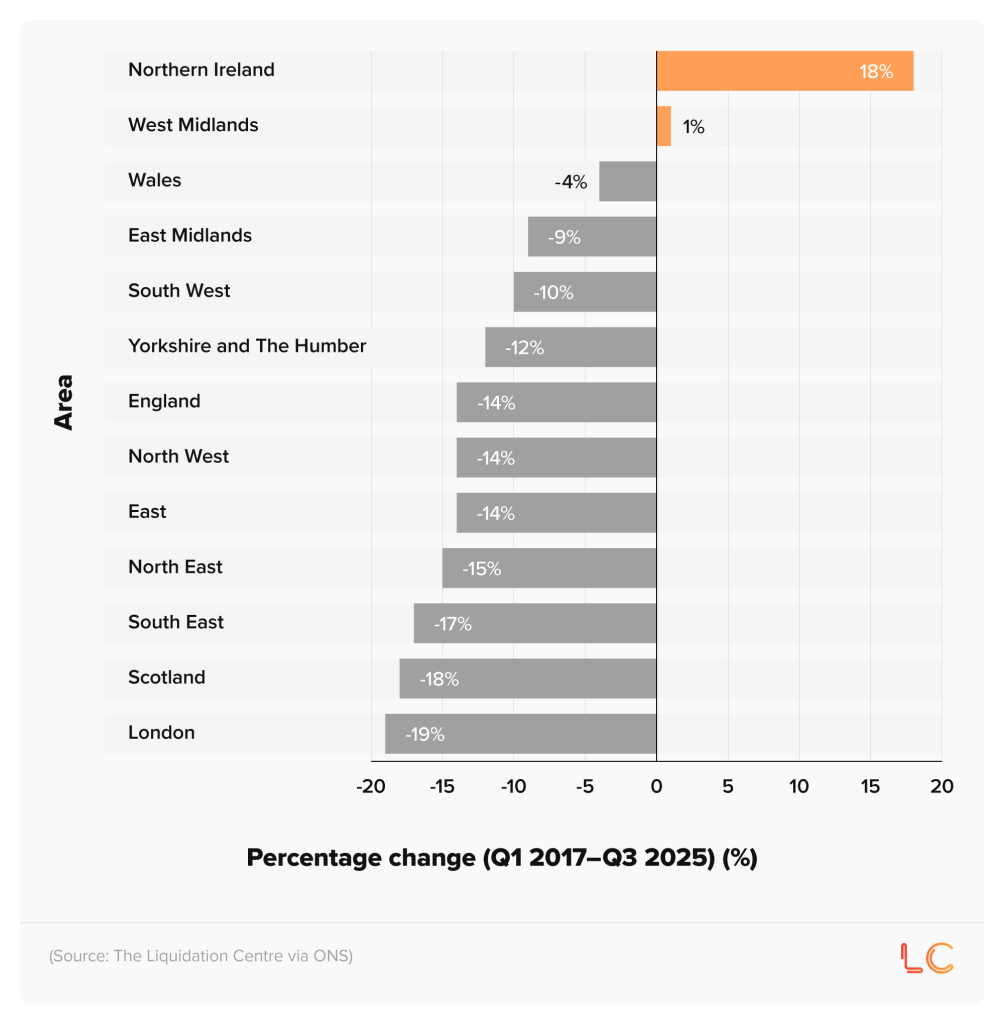
- Northern Ireland experienced 18% more business closures in Q3 2025 than in Q1 2021, the greatest percentage change across all UK regions during this period.
- The West Midlands was the only other region to experience an increase in business closures between Q1 2017 and Q3 2025 (1%).
- London saw the largest decrease in company closures, with 9% fewer in Q3 2025 than in Q1 2017.
In all, 11 of the 13 UK areas analysed by The Liquidation Centre experienced a negative percentage change in the number of business failures between Q1 2017 and Q3 2025.
UK business death-to-birth rate by area over time (2017-25)
| Area | 2017 | 2018 | 2019 | 2020 | 2021 | 2022 | 2023 | 2024 | 2025 |
|---|---|---|---|---|---|---|---|---|---|
| United Kingdom | 0.96 | 0.90 | 0.88 | 0.96 | 0.97 | 1.15 | 1.09 | 0.95 | 0.91 |
| England | 0.93 | 0.88 | 0.88 | 0.94 | 0.96 | 1.13 | 1.09 | 0.95 | 0.90 |
| Wales | 0.95 | 0.84 | 0.88 | 0.96 | 1.05 | 1.14 | 1.18 | 1.06 | 0.99 |
| Scotland | 0.97 | 0.94 | 0.94 | 1.16 | 1.13 | 1.20 | 1.09 | 0.97 | 0.92 |
| Northern Ireland | 0.79 | 0.86 | 0.94 | 0.89 | 0.91 | 1.27 | 1.15 | 0.97 | 1.08 |
| North East | 1.00 | 0.94 | 0.91 | 0.89 | 0.91 | 1.11 | 1.08 | 0.96 | 0.86 |
| North West | 0.91 | 0.94 | 0.91 | 0.89 | 0.96 | 1.11 | 1.14 | 0.95 | 0.87 |
| Yorkshire and the Humber | 1.03 | 0.94 | 0.90 | 0.92 | 0.93 | 0.98 | 1.12 | 0.98 | 0.91 |
| East Midlands | 0.97 | 0.91 | 0.86 | 0.89 | 0.99 | 1.13 | 1.17 | 1.05 | 0.96 |
| West Midlands | 0.94 | 0.90 | 0.91 | 0.92 | 0.89 | 1.17 | 1.20 | 0.97 | 0.97 |
| East | 0.96 | 0.89 | 0.88 | 0.98 | 1.01 | 1.15 | 1.06 | 0.97 | 0.92 |
| London | 0.88 | 0.82 | 0.82 | 0.94 | 0.91 | 1.11 | 1.00 | 0.86 | 0.83 |
| South East | 0.94 | 0.85 | 0.88 | 1.01 | 1.07 | 1.24 | 1.08 | 0.96 | 0.93 |
| South West | 0.97 | 0.93 | 0.93 | 0.96 | 0.97 | 1.12 | 1.13 | 1.03 | 0.98 |
(Source: The Liquidation Centre via ONS)
Note: Data for 2025 is only for Q1-Q3. A value greater than one signifies that there were more business deaths than births, and a value lower than one signifies there were more company births than deaths.
As of 2025, the death-to-birth rate for UK businesses stood at 0.91, and for every company born that year, an average of 0.91 businesses died (i.e., shut down).
This rate fluctuated between 2017 and 2025, from a low of 0.88 in 2019 to a high of 1.15 in 2022. Across the country, Northern Ireland was the only region in 2025 to register a business death-to-birth ratio above one, with 1.08 companies failing for every startup.
The number of UK businesses that fail by industry over time (2019-28)
There were 42,260 business closures in the UK professional, scientific, and technical activities industry during 2024, the most across all sectors. This was followed by 32,410 in construction and 34,415 companies in business administration and support services.
Based on historical trends, business failure rates are predicted to increase by 12.4% in the UK construction industry, making it the sector with the highest number of company closures in 2028.Conversely, the number of corporations expected to shut down in the professional, scientific, and technical activities sector is anticipated to fall by approximately 16% by 2028, to almost 35,500 company closures for the year.
Percentage change of UK business failure statistics by industry over time (2017-25)
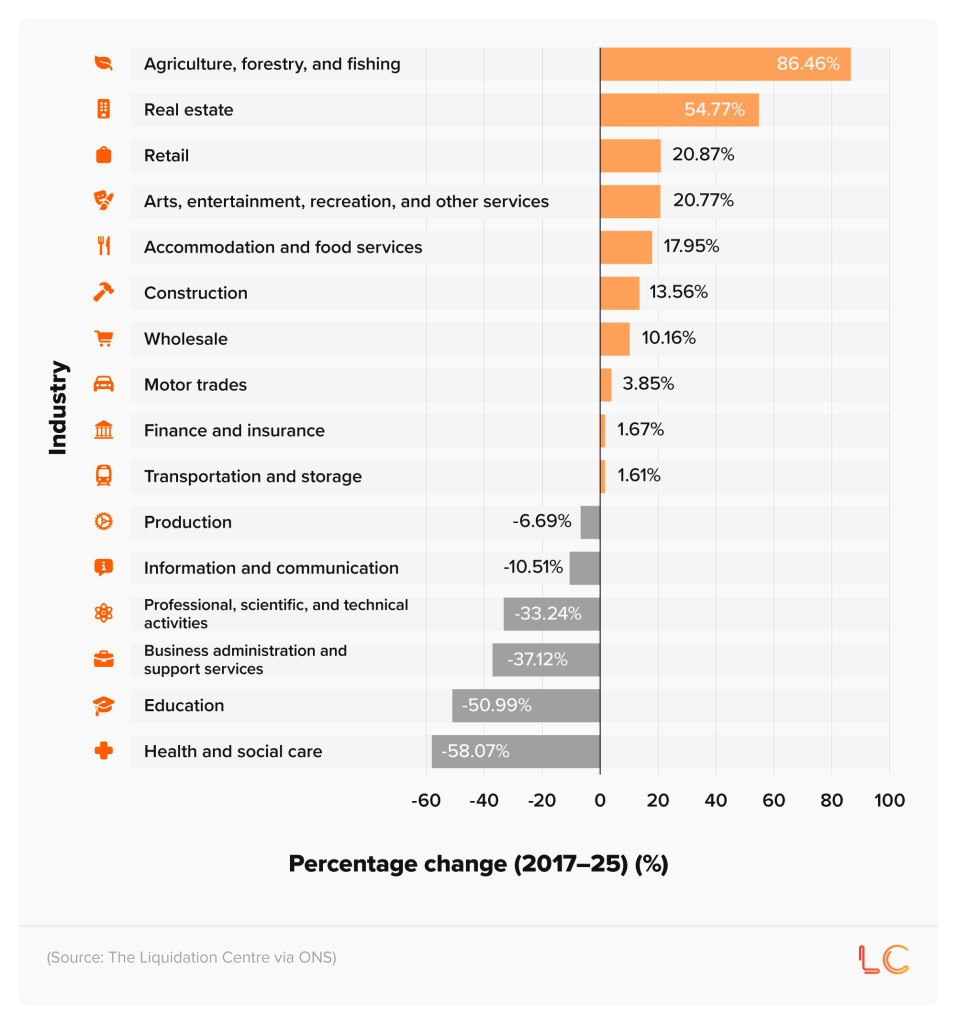
Between 2017 and 2025, the percentage of UK business failures in the agriculture, forestry, and fishing industry grew by 86.46%, the largest across all sectors during this period.
This was followed by the real estate industry and the retail sector, which saw increases of 54.77% and 20.87%, respectively, in the number of company closures.
At the other end of the scale, the proportion of businesses in business administration and support services fell by -58.07% and by half in the education sector (-50.99%).
Richard Hunt, Insolvency Practitioner at Liquidation Centre, said:
"Some sectors are more likely to experience business closures because they face a mix of higher costs, tighter margins and greater exposure to changing market conditions.
Industries like agriculture and retail can be heavily affected by factors outside their control, such as weather, supply-chain pressures, shifts in consumer spending and rising operating costs, which makes them more vulnerable when conditions worsen. Areas like education or business support services tend to have steadier demand and more predictable income, so businesses in these sectors are generally better able to withstand economic ups and downs.
Overall, the likelihood of closure often comes down to how stable demand is, how much costs can fluctuate, and how easily businesses in that sector can adapt to change."
Startup failure rate statistics
In 2024, less than half (46%) of UK insolvencies were attributed to startups. This figure shows a YoY decrease since 2021, when it stood at 60%
The proportion of UK startup and non-startup insolvencies over time vs new company incorporations (2014-24)
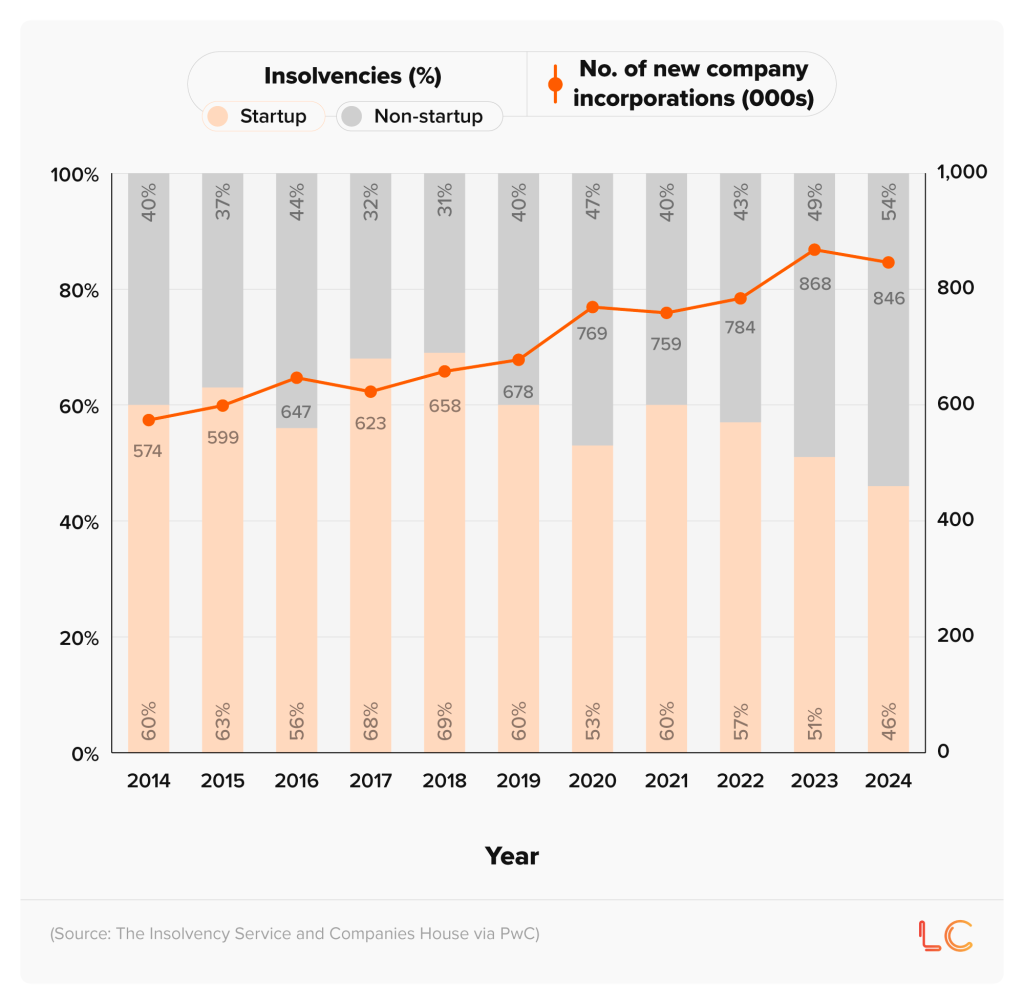
In 2018, almost seven in 10 (69%) of UK insolvencies were among startups (the highest recorded figure between 2014 and 2024).
The number of new company incorporations rose by almost half (47.39%), from 574,000 in 2014 up to 846,000 10 years later.
The number of UK startup and non-startup insolvencies over time (2014-28) and year-on-year (YoY) percentage change (2014-24)
| Year | No. of startup insolvencies | No. of non-startup insolvencies | Percentage change (startup insolvencies) (%) | Percentage change (non-startup insolvencies) (%) |
|---|---|---|---|---|
| 2014 | 9,802 | 6,452 | - | - |
| 2015 | 9,172 | 5,457 | -6% | -15% |
| 2016 | 9,218 | 7,284 | 1% | 33% |
| 2017 | 11,754 | 5,489 | 28% | -25% |
| 2018 | 11,135 | 4,955 | -5% | -10% |
| 2019 | 10,266 | 6,930 | -8% | 40% |
| 2020 | 6,643 | 5,991 | -35% | -14% |
| 2021 | 8,428 | 5,620 | 27% | -6% |
| 2022 | 12,629 | 9,480 | 50% | 69% |
| 2023 | 12,841 | 12,317 | 2% | 30% |
| 2024 | 10,990 | 12,882 | -14% | 5% |
| 2025* | 11,735 | 11,712 | - | - |
| 2026* | 11,909 | 12,320 | - | - |
| 2027* | 12,084 | 12,928 | - | - |
| 2028* | 12,258 | 13,535 | - | - |
(Source: The Liquidation Centre via The Insolvency Service and Companies House)
*Forecasted figures
As of 2024, there were 10,990 insolvencies among startups across the UK, compared to 12,882 among non-startups. This represented a 14.4% decrease for startup businesses compared to the previous year and a 4.6% increase for non-startup corporations.
This was also the first time during this period in which there were more insolvencies among non-startups than among startups.
An analysis of insolvency statistics indicates that the number of insolvencies among startups has fluctuated since 2014, peaking at 12,841 in 2023 and dipping to 6,643 in 2020. Conversely, the number of insolvencies among non-startups has traditionally been less than 10,000 a year, until 2023, when it jumped above 12,000.
Should current trends continue, our forecasts suggest that the number of startup insolvencies could reach 12,258 by 2028 (a rise of 11.5% from 2024) and 13,535 for non-startup insolvencies (an increase of5.1% in four years).
The percentage of UK startups that fail in the UK over time by region
Our analysis of ONS data shows that 295,140 startups from 2023 were still in operation a year later, yielding a 93.4% survival rate. Conversely, 20,885 failed in their first year, producing a startup failure rate of 6.6%.
Yorkshire and the Humber and the West Midlands both had the highest startup failure rate in 2024, at 7.5%. This was followed closely by the North East (7.4%).
The number and percentage of 2023 UK startups that survive and fail their first year by region
| Region | No. of company births | No. of companies that survive (1 year) | Percentage (%) | No. of companies that fail (1 year) | Percentage (%) |
|---|---|---|---|---|---|
| Yorkshire and the Humber | 22,280 | 20,620 | 92.5% | 1,660 | 7.5% |
| West Midlands | 26,275 | 24,300 | 92.5% | 1,975 | 7.5% |
| North East | 8,970 | 8,310 | 92.6% | 660 | 7.4% |
| East Midlands | 20,495 | 19,030 | 92.9% | 1,465 | 7.1% |
| North West | 33,005 | 30,690 | 93.0% | 2,315 | 7.0% |
| Northern Ireland | 5,365 | 4,995 | 93.1% | 370 | 6.9% |
| Wales | 10,520 | 9,800 | 93.2% | 720 | 6.8% |
| South West | 22,875 | 21,375 | 93.4% | 1,500 | 6.6% |
| London | 74,650 | 69,875 | 93.6% | 4,775 | 6.4% |
| East | 30,360 | 28,490 | 93.8% | 1,870 | 6.2% |
| Scotland | 18,275 | 17,180 | 94.0% | 1,095 | 6.0% |
| South East | 42,955 | 40,475 | 94.2% | 2,480 | 5.8% |
| UK (Total) | 316,025 | 295,140 | 93.4% | 20,885 | 6.6% |
(Source: The Liquidation Centre via ONS)
At the other end of the scale, around one in 20 (5.8%) businesses in the South East failed to survive past their first year.
The number and percentage of 2022 UK startups that survive and fail after two years by region
| Region | No. of company births | No. of companies that survive (2 years) | Percentage (%) | No. of companies that fail (2 years) | Percentage (%) |
|---|---|---|---|---|---|
| Yorkshire and the Humber | 25,890 | 16,780 | 64.8% | 9,110 | 35.2% |
| West Midlands | 28,695 | 18,620 | 64.9% | 10,075 | 35.1% |
| Wales | 12,090 | 7,875 | 65.1% | 4,215 | 34.9% |
| East Midlands | 22,685 | 15,300 | 67.4% | 7,385 | 32.6% |
| North East | 9,725 | 6,560 | 67.5% | 3,165 | 32.5% |
| North West | 36,220 | 24,470 | 67.6% | 11,750 | 32.4% |
| London | 76,845 | 53,525 | 69.7% | 23,320 | 30.3% |
| East | 31,850 | 22,230 | 69.8% | 9,620 | 30.2% |
| South West | 24,510 | 17,275 | 70.5% | 7,235 | 29.5% |
| Scotland | 18,870 | 13,450 | 71.3% | 5,420 | 28.7% |
| Northern Ireland | 5,385 | 3,840 | 71.3% | 1,545 | 28.7% |
| South East | 44,160 | 32,200 | 72.9% | 11,960 | 27.1% |
| UK (Total) | 336,925 | 232,125 | 68.9% | 104,800 | 31.5% |
(Source: The Liquidation Centre via ONS)
On average, around three in 10 (31.5%) UK startups fail within the first two years.
The highest rates are found in Yorkshire and the Humber (35.2%) and the West Midlands (35.1%). This is contrasted with just over a quarter (27.1%) of startups in the South East that began life in 2022 but ceased to exist in 2024.
The number and percentage of 2021 UK startups that survive and fail after three years by region
| Region | No. of company births | No. of companies that survive (3 years) | Percentage (%) | No. of companies that fail (3 years) | Percentage (%) |
|---|---|---|---|---|---|
| West Midlands | 34,155 | 15,340 | 44.9% | 18,815 | 55.1% |
| Wales | 13,945 | 6,640 | 47.6% | 7,305 | 52.4% |
| North West | 39,135 | 19,450 | 49.7% | 19,685 | 50.3% |
| East Midlands | 23,370 | 11,990 | 51.3% | 11,380 | 48.7% |
| North East | 10,080 | 5,230 | 51.9% | 4,850 | 48.1% |
| Yorkshire and the Humber | 24,980 | 13,425 | 53.7% | 11,555 | 46.3% |
| Northern Ireland | 6,655 | 3,605 | 54.2% | 3,050 | 45.8% |
| London | 85,305 | 46,360 | 54.3% | 38,945 | 45.7% |
| East | 33,150 | 18,715 | 56.5% | 14,435 | 43.5% |
| Scotland | 18,910 | 10,895 | 57.6% | 8,015 | 42.4% |
| South East | 48,375 | 27,975 | 57.8% | 20,400 | 42.2% |
| South West | 25,935 | 15,060 | 58.1% | 10,875 | 41.9% |
| Total (UK) | 363,995 | 194,685 | 53.5% | 169,310 | 46.5% |
After three years, less than half (46.5%) of UK startups are still in operation. This startup failure rate rises to 55.1% in the West Midlands, where more than half of all businesses that started in 2021 had closed by 2024.
Conversely, around two in five (41.9%) startups in the South West fail after three years. This represents the lowest startup business failure rate across all UK regions for those companies born in 2021.
The number and percentage of 2020 UK startups that survive and fail after four years by region
| Region | No. of company births | No. of companies that survive (4 years) | Percentage (%) | No. of companies that fail (4 years) | Percentage (%) |
|---|---|---|---|---|---|
| West Midlands | 28,145 | 11,285 | 40.1% | 16,860 | 59.9% |
| East Midlands | 22,890 | 9,305 | 40.7% | 13,585 | 59.3% |
| Wales | 11,385 | 4,680 | 41.1% | 6,705 | 58.9% |
| North West | 35,505 | 14,675 | 41.3% | 20,830 | 58.7% |
| North East | 9,085 | 3,880 | 42.7% | 5,205 | 57.3% |
| London | 79,640 | 35,085 | 44.1% | 44,555 | 55.9% |
| Yorkshire and the Humber | 22,655 | 10,035 | 44.3% | 12,620 | 55.7% |
| South East | 47,685 | 21,550 | 45.2% | 26,135 | 54.8% |
| Scotland | 16,850 | 7,840 | 46.5% | 9,010 | 53.5% |
| East | 30,140 | 14,210 | 47.1% | 15,930 | 52.9% |
| South West | 23,365 | 11,020 | 47.2% | 12,345 | 52.8% |
| Northern Ireland | 5,670 | 2,850 | 50.3% | 2,820 | 49.7% |
| Total | 333,015 | 146,415 | 44% | 186,600 | 56% |
(Source: The Liquidation Centre via ONS)
On average, more than half (56%) of UK startups don't survive beyond their fourth year.
The percentage of startups that fail after four years rises to almost three in five (59.9%) in the West Midlands and drops to a low of 49.7% in Northern Ireland.
The number and percentage of 2019 UK startups that survive and fail after five years by region.
| Region | No. of company births | No. of companies that survive (5 years) | Percentage (%) | No. of companies that fail (5 years) | Percentage (%) |
|---|---|---|---|---|---|
| West Midlands | 34,440 | 10,535 | 30.6% | 23,905 | 69.4% |
| North West | 36,805 | 13,455 | 36.6% | 23,350 | 63.4% |
| Wales | 11,745 | 4,470 | 38.1% | 7,275 | 61.9% |
| London | 88,550 | 33,785 | 38.2% | 54,765 | 61.8% |
| East Midlands | 23,215 | 8,945 | 38.5% | 14,270 | 61.5% |
| North East | 9,445 | 3,675 | 38.9% | 5,770 | 61.1% |
| Scotland | 20,680 | 8,125 | 39.3% | 12,555 | 60.7% |
| Yorkshire and the Humber | 23,400 | 9,380 | 40.1% | 14,020 | 59.9% |
| South East | 51,560 | 20,715 | 40.2% | 30,845 | 59.8% |
| East | 33,995 | 13,745 | 40.4% | 20,250 | 59.6% |
| Northern Ireland | 6,045 | 2,590 | 42.8% | 3,455 | 57.2% |
| South West | 23,945 | 10,425 | 43.5% | 13,520 | 56.5% |
| Total | 363,825 | 139,845 | 38.4% | 223,980 | 61.6% |
(Source: The Liquidation Centre via ONS)
After five years, more than three-fifths (61.6%) of UK startups have failed.
Startup failure rates are highest in the West Midlands, where 69.4% businesses that started in 2019 ceased to exist in 2024.
However, the new business failure rate is lowest in the South West, where 56.5% were not in operation five years later.
The number and percentage of 2023 UK startups that survive and fail after their first year by industry
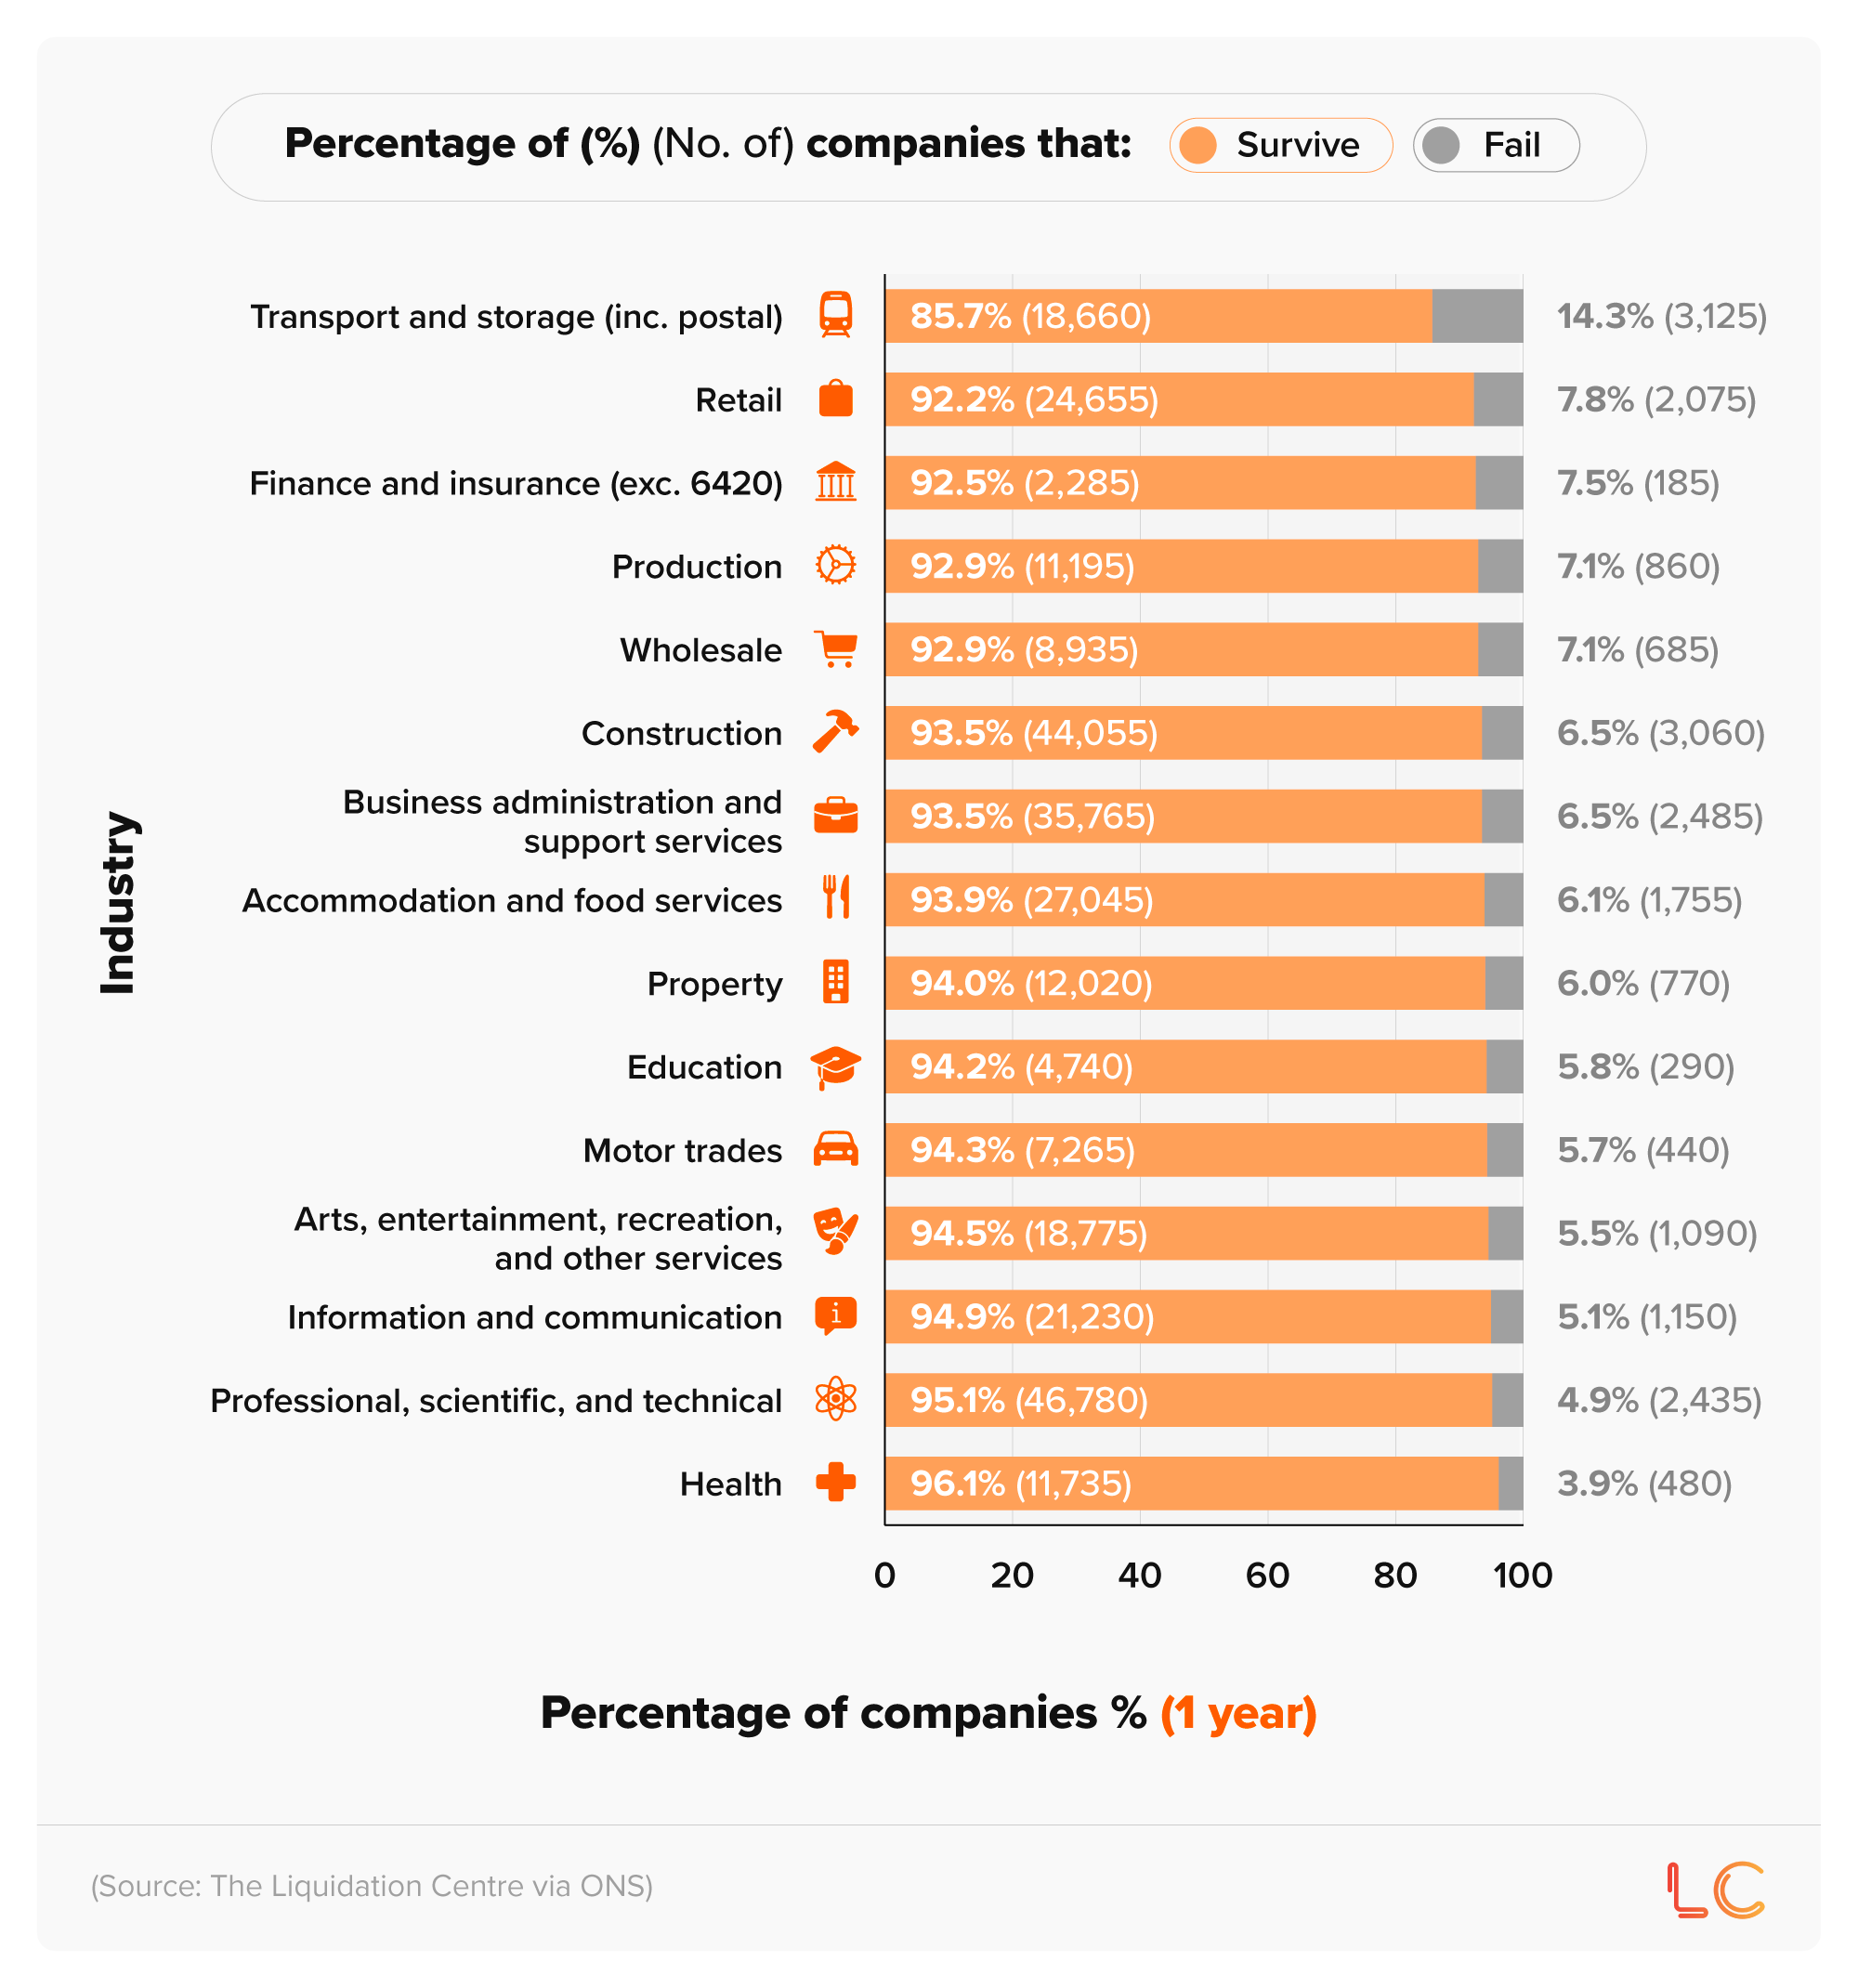
Around one in seven (14.3%) businesses in the transport and storage industry fail after their first year, the highest rate across all categories.
This was more than double the startup failure rate for those in production and wholesale (both 7.1%).
That said, less than one in 20 startups from the professional, scientific, and technical sector (4.9%) and the health industry (3.9%) managed to survive past their first year. This represented the lowest failure rate for new businesses across all categories for 2024.
The number and percentage of 2022 UK startups that survive and fail after two years by industry
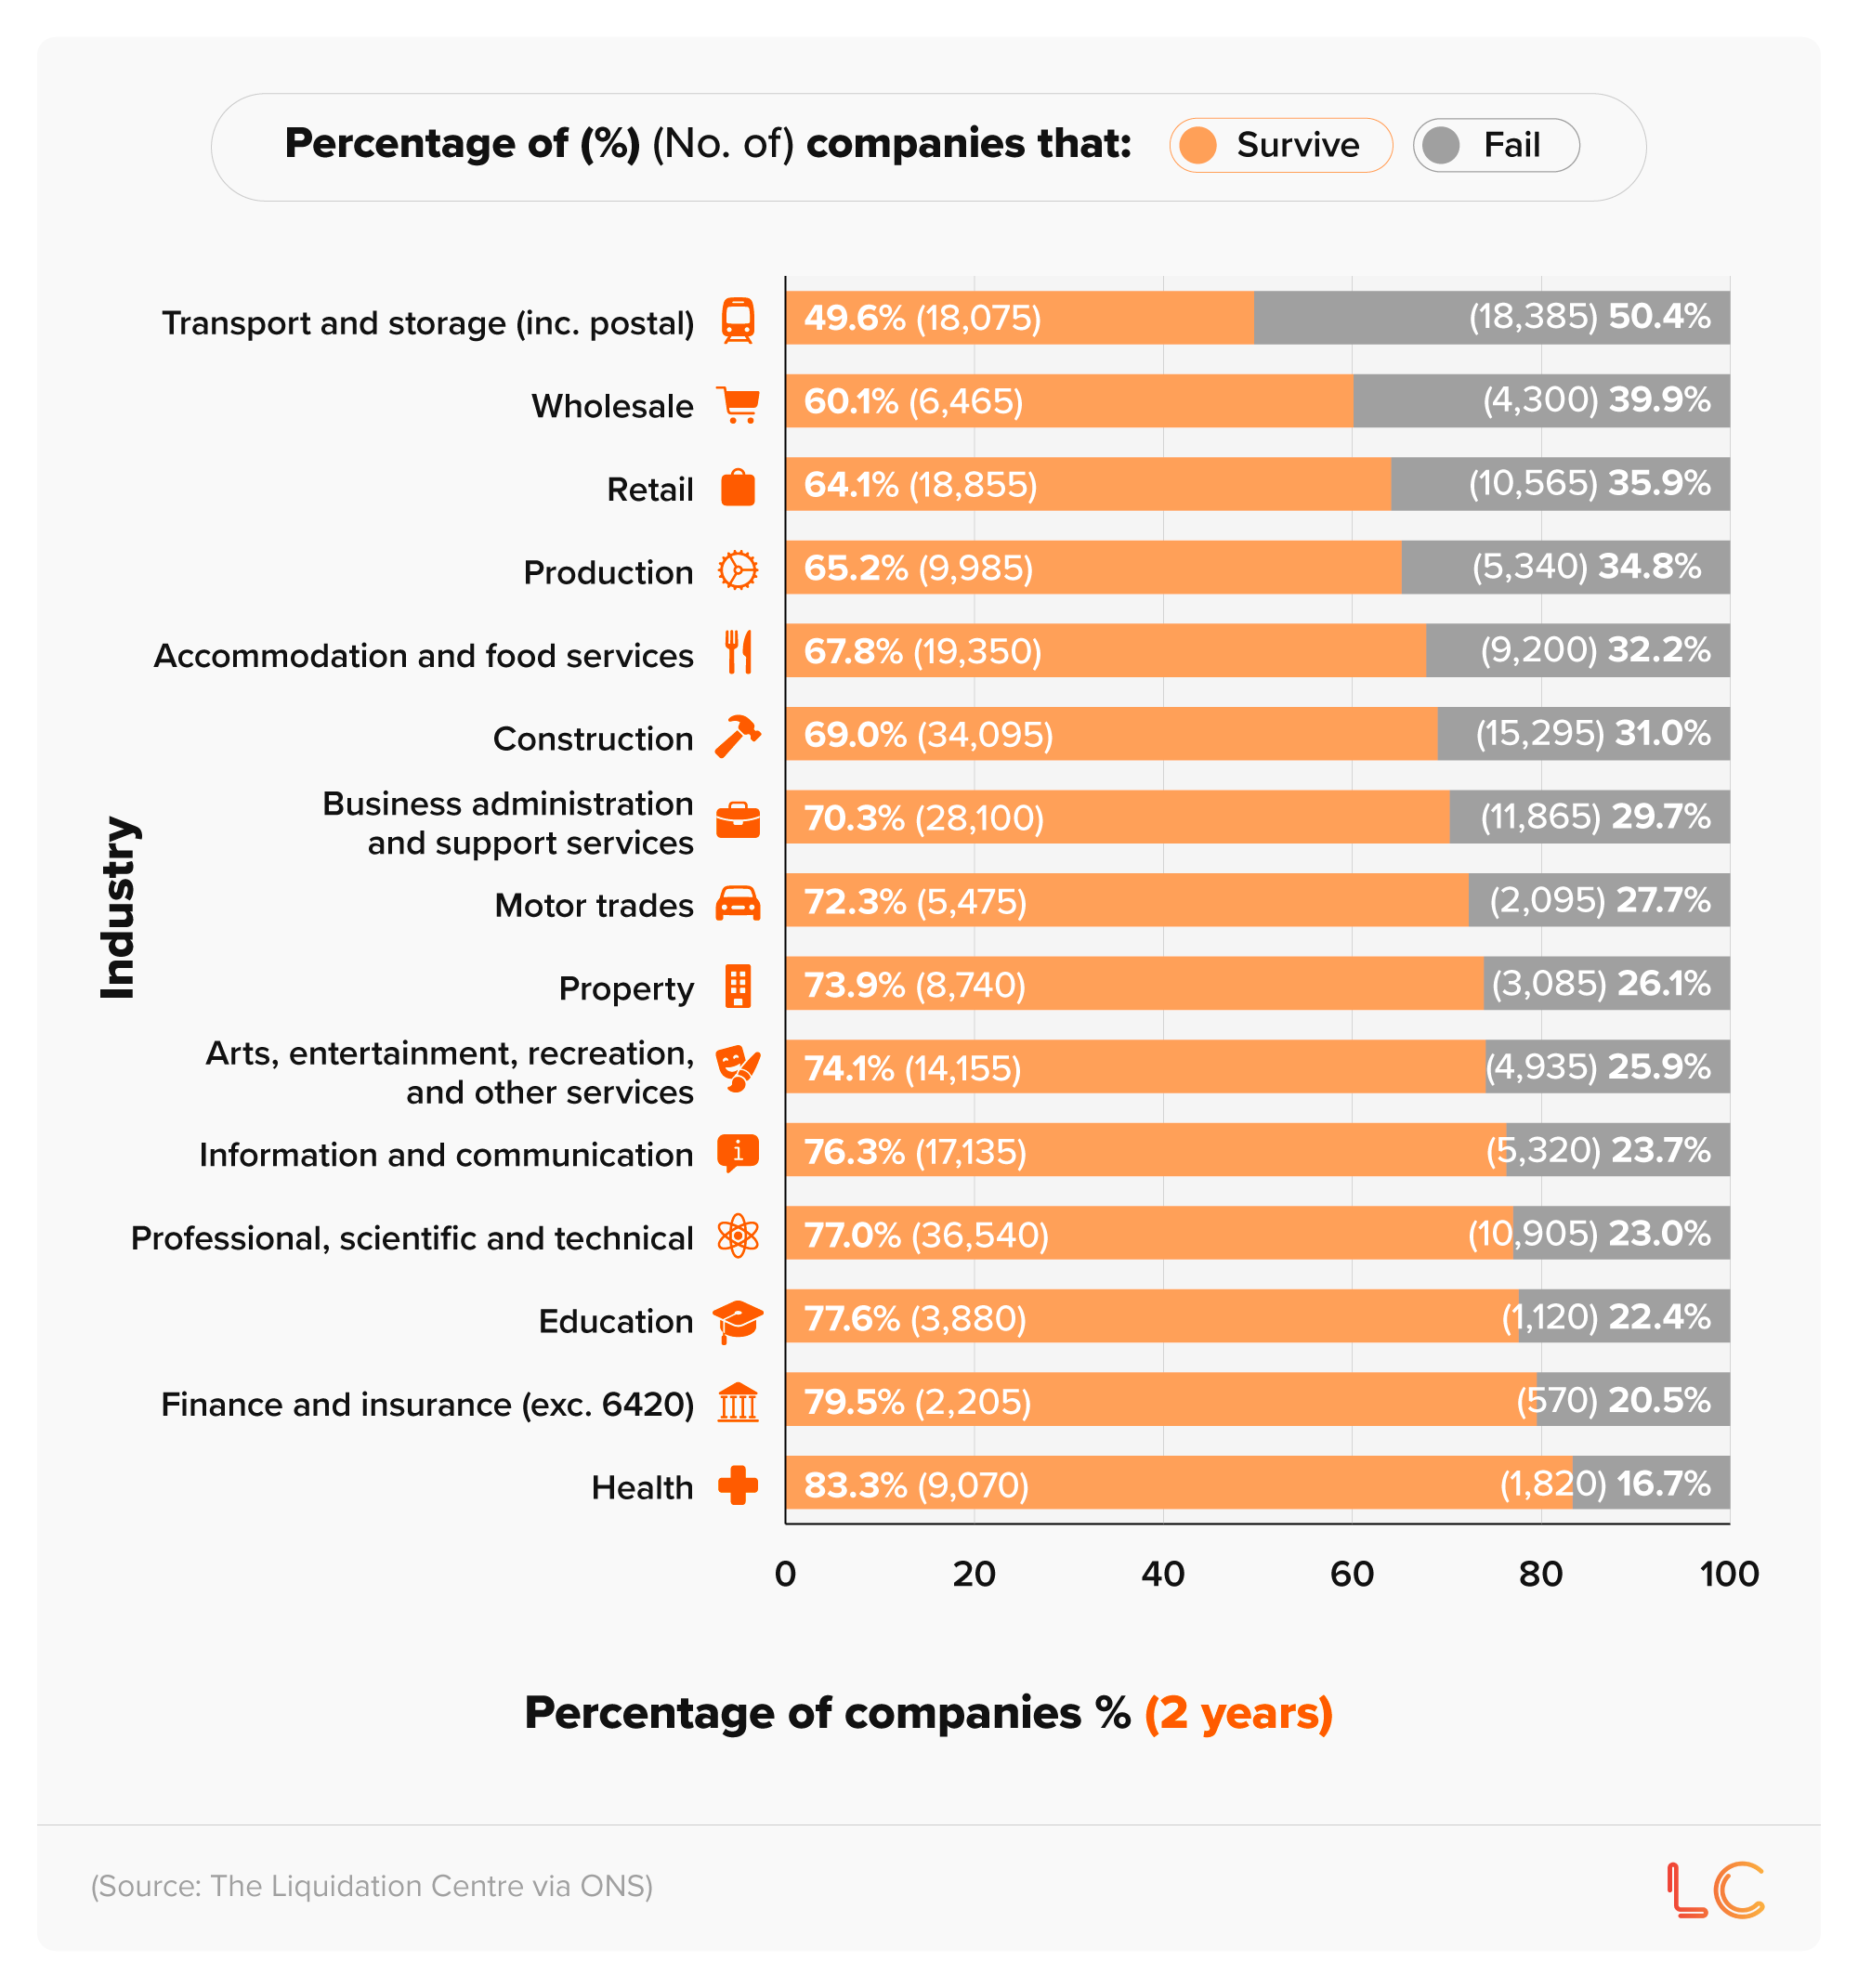
On average, more than half (50.4%) of companies formed in the transport and storage sector fail to survive past their second year.
This was followed by those in wholesale, with a startup failure rate of 39.9%.
At the other end of the scale, the lowest failure rate after two years is in the health sector (16.7%). This means that a transport and storage startup corporation is around three times more likely to fold after two years than a health-based one.
The number and percentage of 2021 UK startups that survive and fail after three years by industry
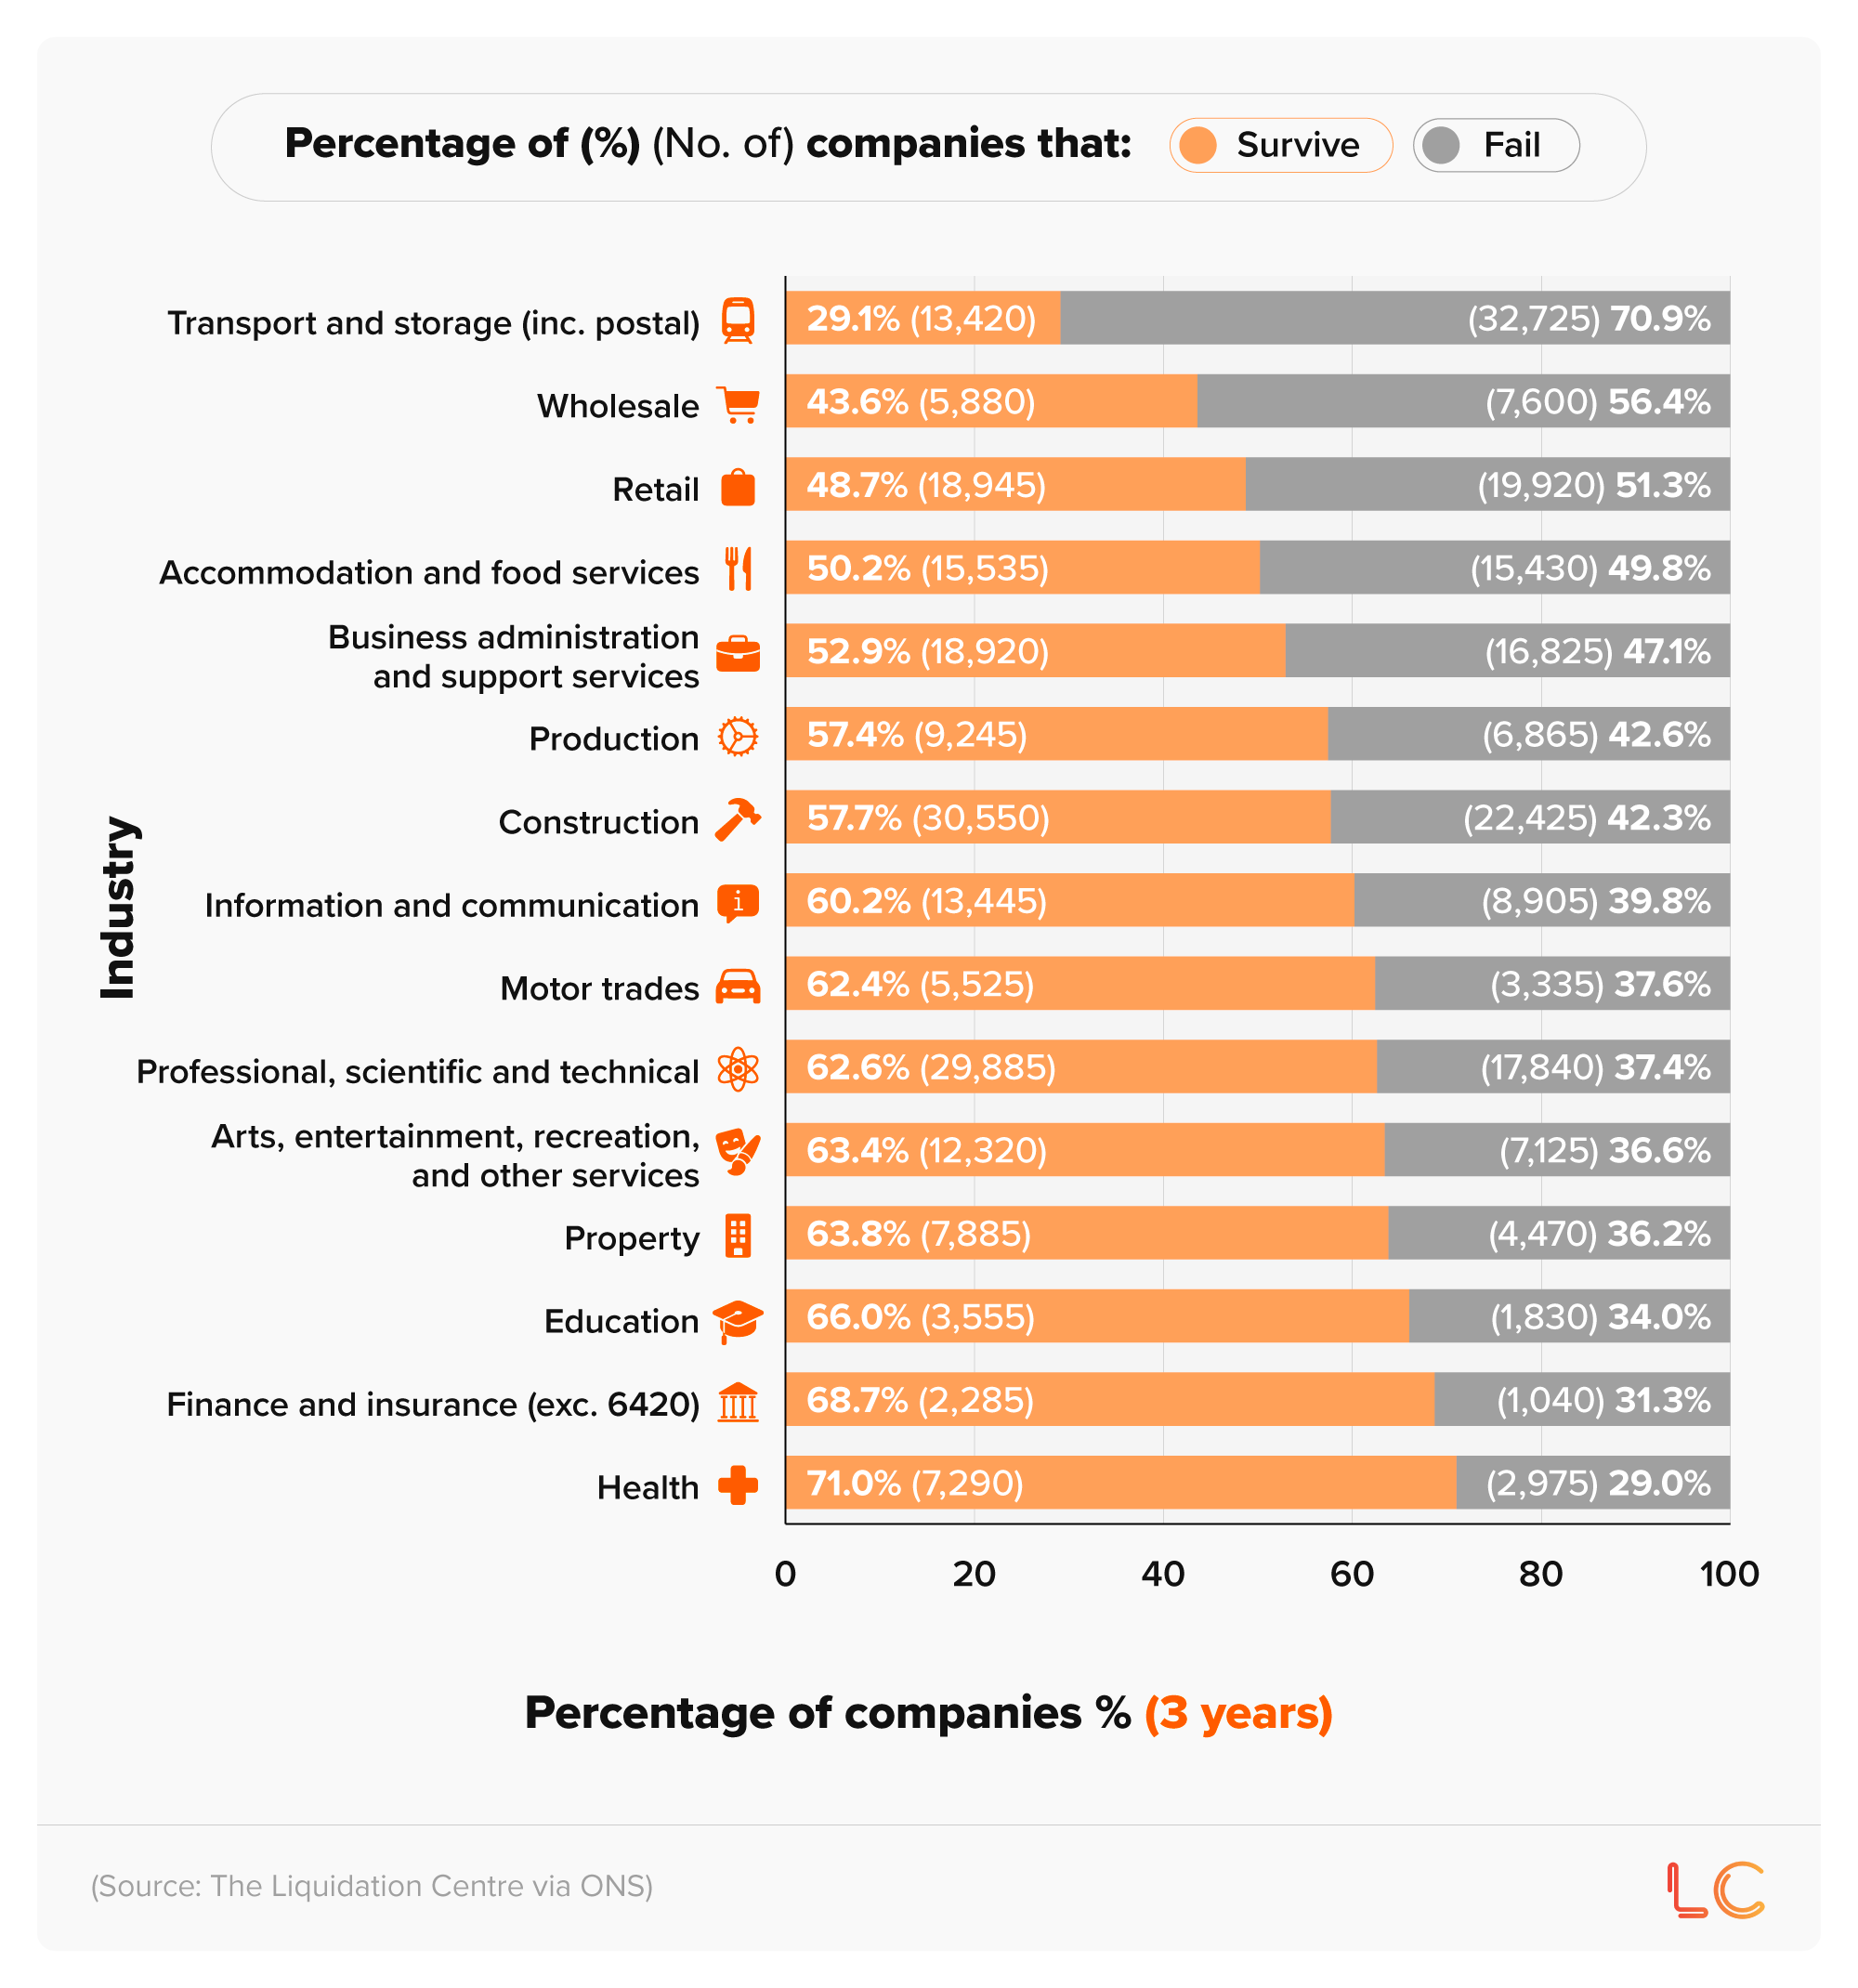
Approximately seven in 10 (70.9%) companies in the transport and storage sector fail within 3 years. This is about double the startup failure rate in the education industry (34%).
The lowest new business failure rate after three years is in health, where almost three in 10 (29%) of those corporations that began life in 2021 ceased to exist in 2024.
The number and percentage of 2020 UK startups that survive and fail after four years by industry
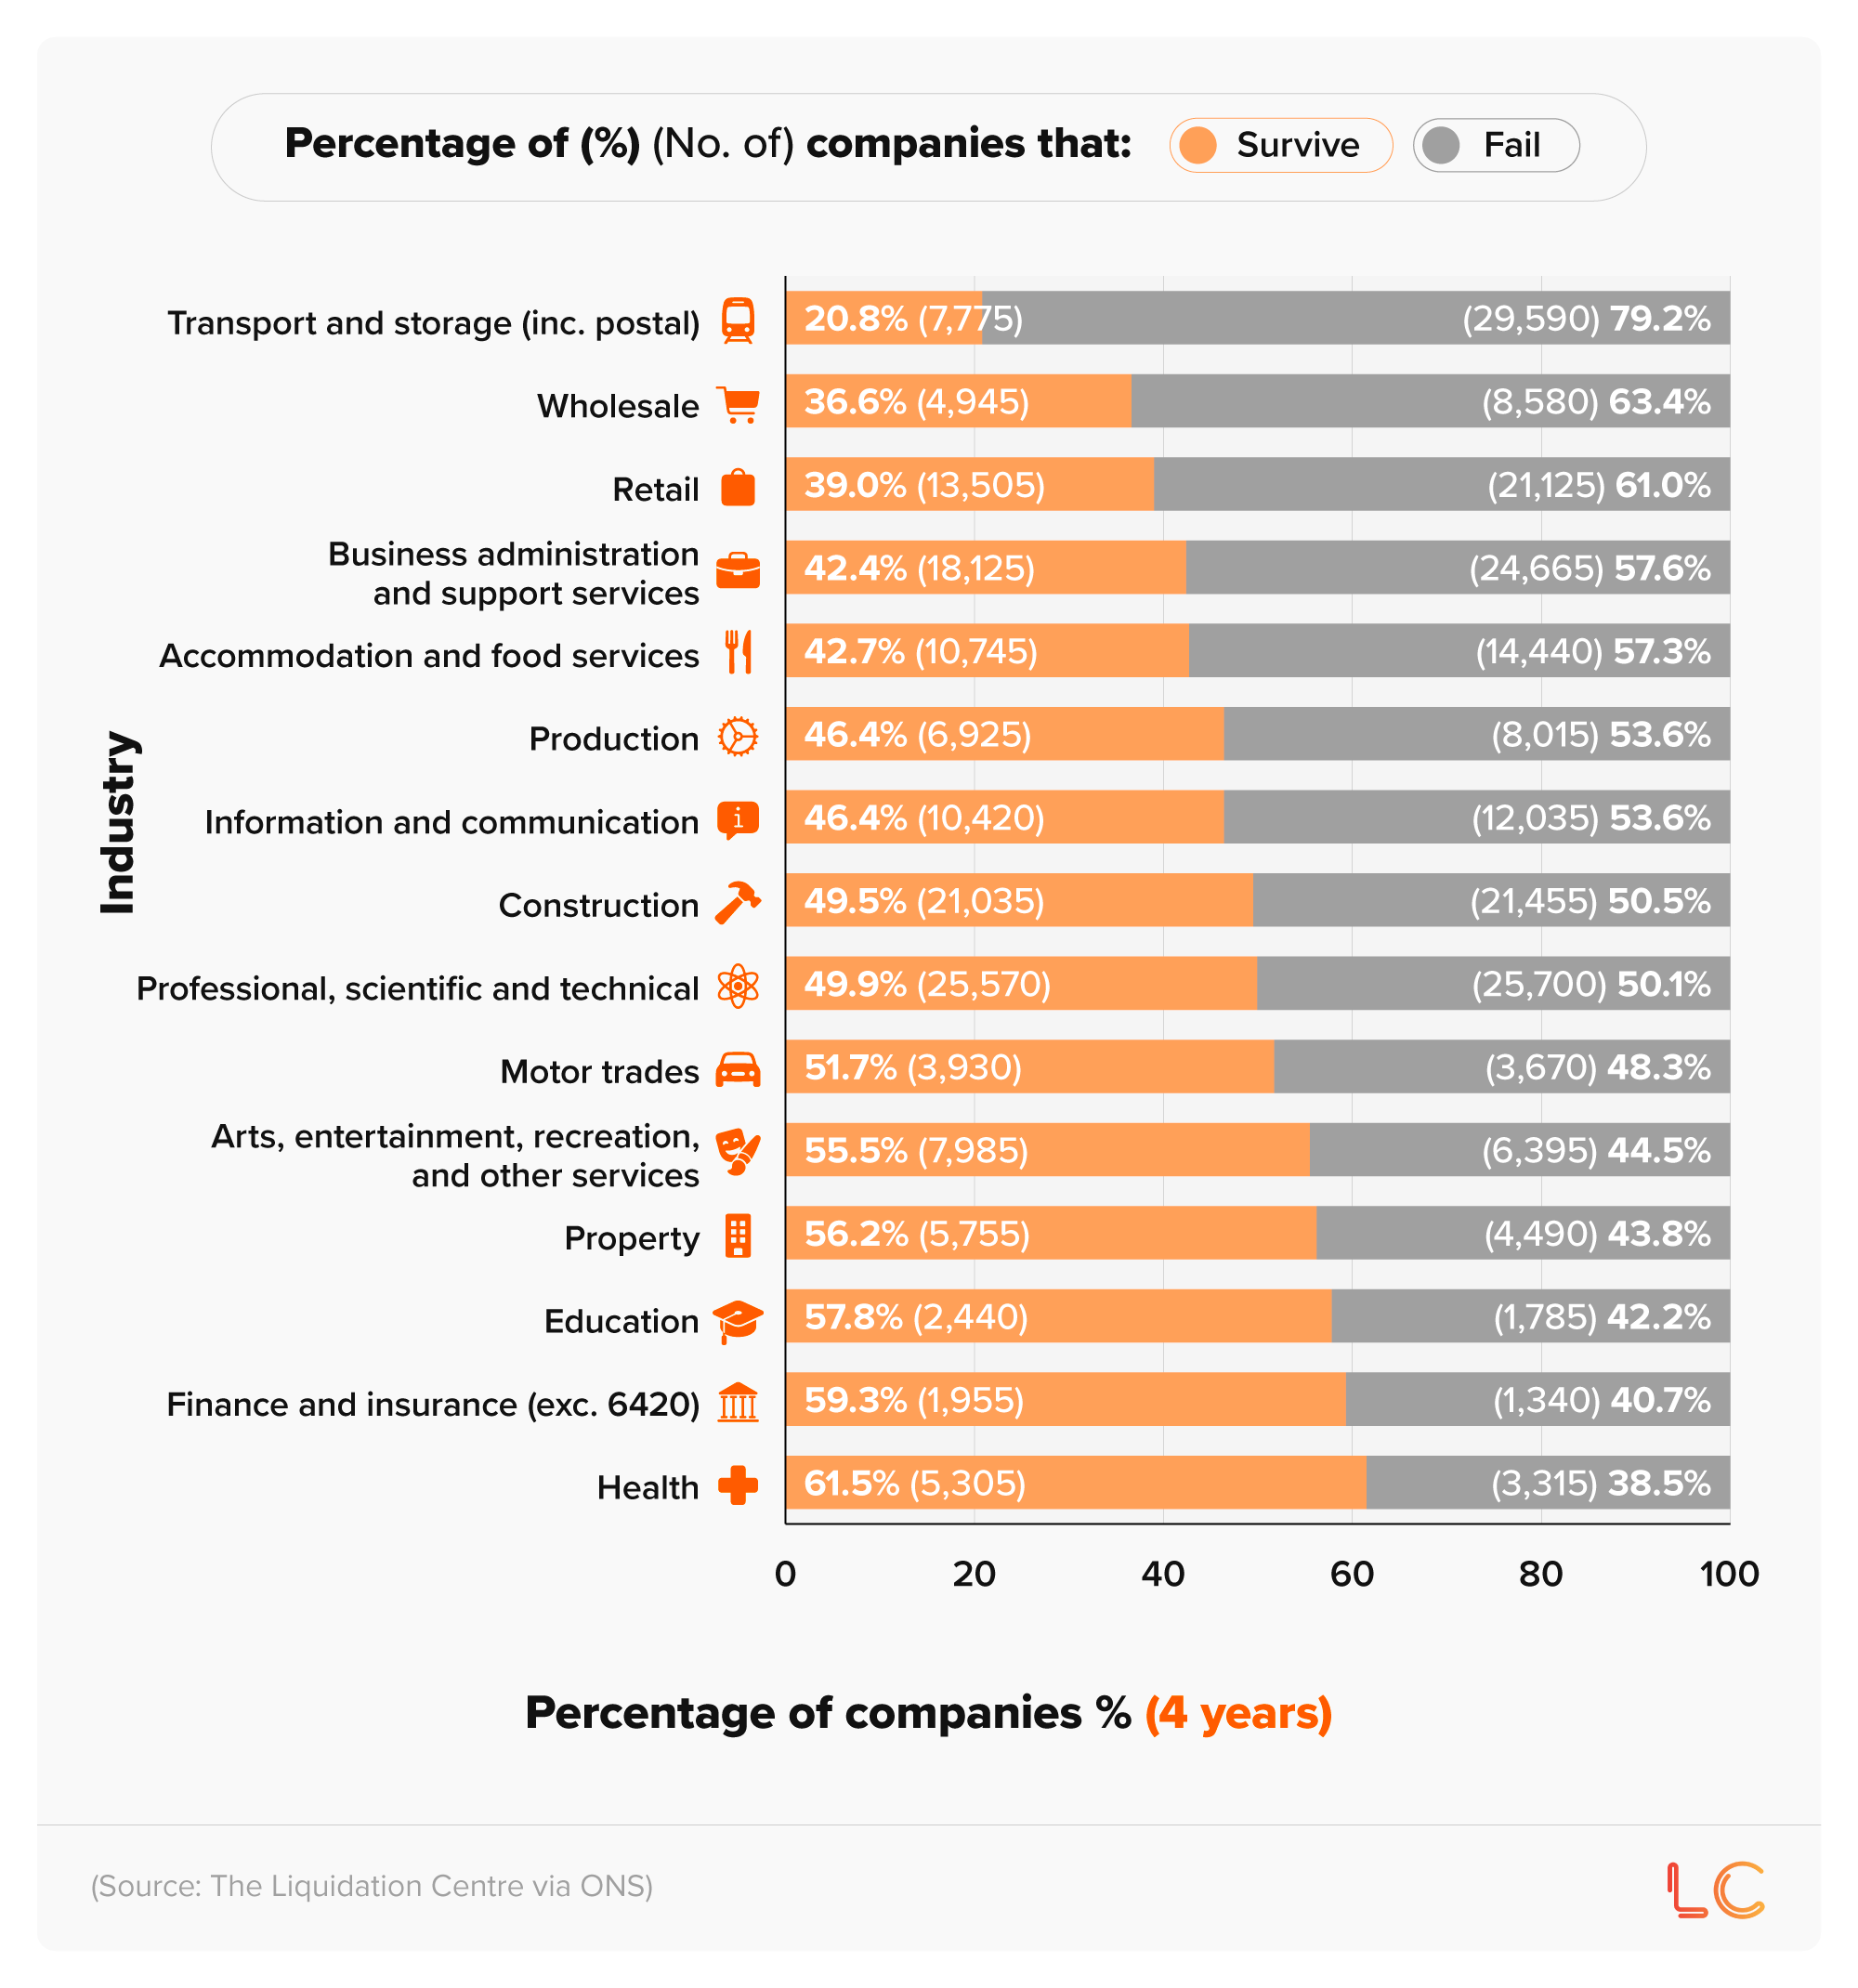
After four years of trading, roughly four in five (79.2%) startups in the transport and storage sector cease to exist. This is contrasted by just under two-fifths (38.5%) of health-based startups.
Furthermore, just over half of construction enterprises (50.5%) and startups from the professional, scientific, and technical industry (50.1%) that formed in 2020 were still in operation as of 2024.
The number and percentage of 2019 UK startups that survive and fail after five years by industry
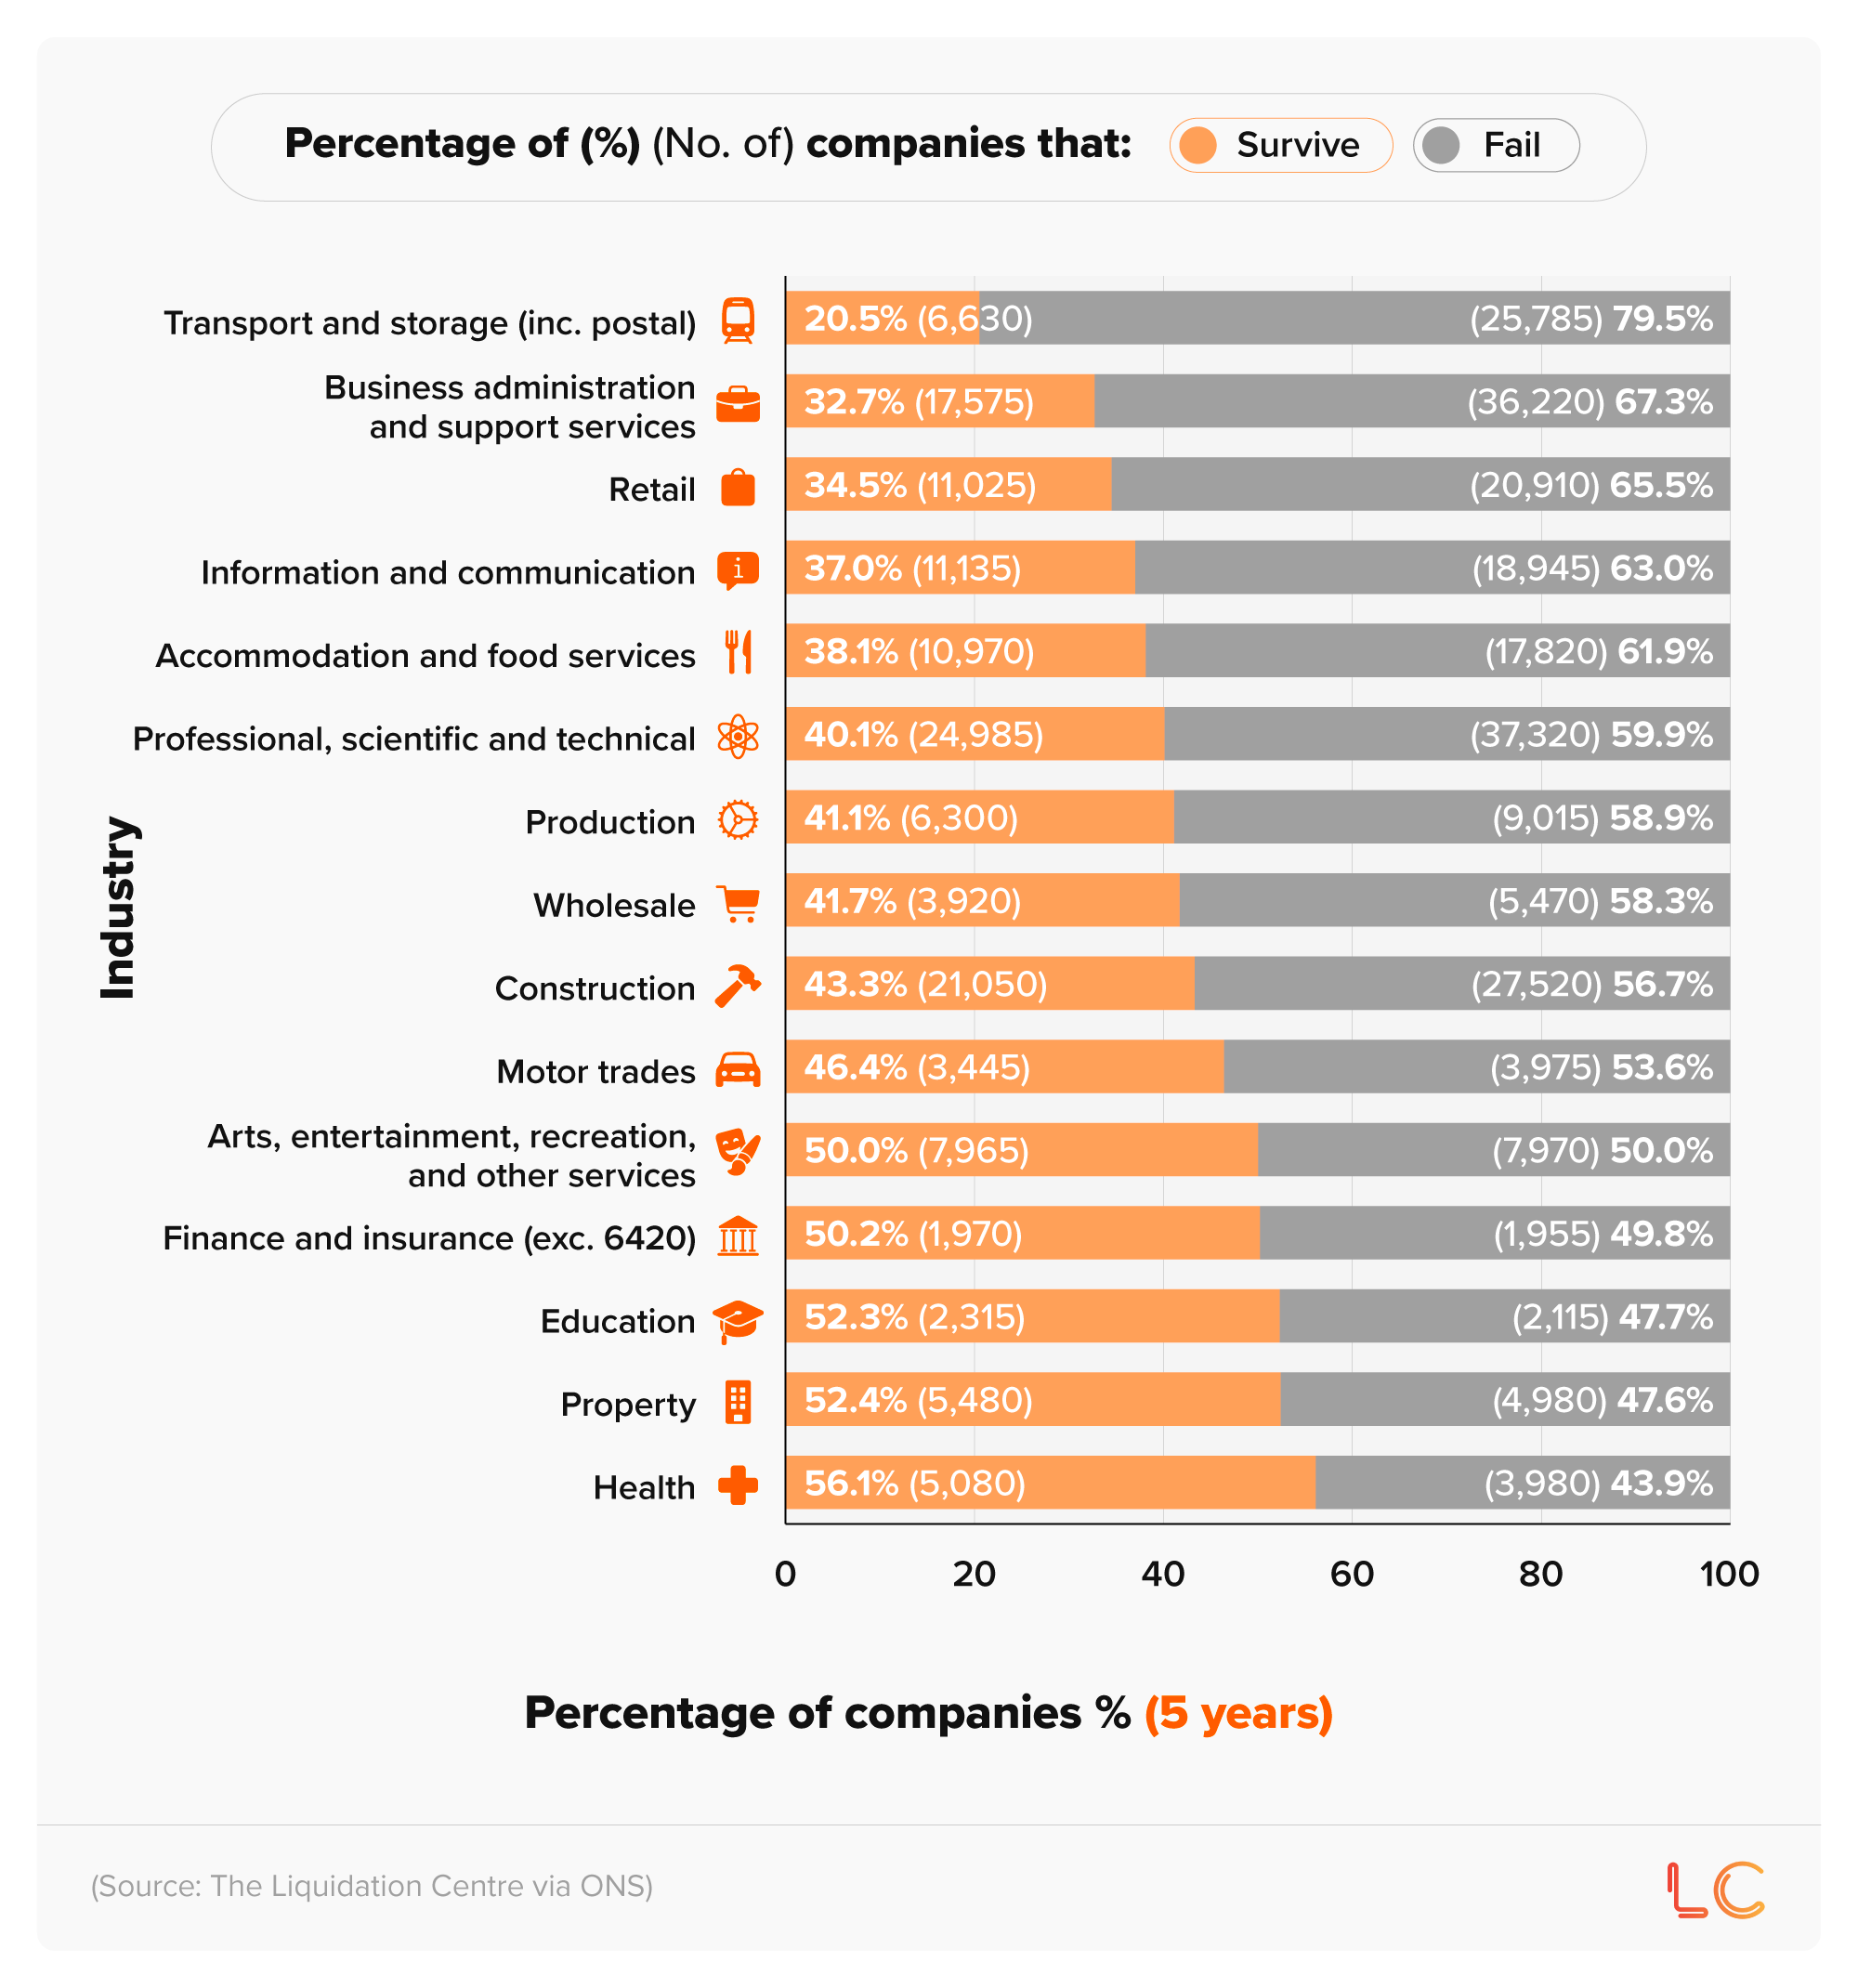
After five years, the chance of a transport and storage startup failing in the UK stands at 79.5%. This is the highest recorded figure across all sectors and is followed by business administration and support services, where 67.3% of those started in 2019 had folded by 2024.
Conversely, just over two-fifths (43.9%) of health-based startups in 2019 had failed by their fifth year, the lowest recorded startup failure rate across all industries.
Did you know?
According to our index study of the top 10 countries for startups, the UK ranks second with a score of 9.6 out of 10.
UK town centre liquidation rates (exclusive data)
Our analysis of liquidation statistics indicates that Norwich had the highest liquidation rate among UK town centres as of 2025.
With 6,324 companies located within a 500m radius and 2,933 liquidated companies throughout the year, the liquidation rate was 46.38%. This means that just under half of those companies based in Norwich went through liquidation in 2025.
This was followed by Sefton and Swansea, where approximately three in 10 companies went into liquidation in 2025 (30.62% and 30.45%, respectively).
The highest and lowest liquidation rates for UK town centres
There were no registered liquidations on the high streets of the New Forest and South Lanarkshire in 2025. These were the only two town centres to generate a liquidation rate of 0%.
This was followed by Herefordshire and Harlow, at 0.07% and 0.08%, respectively.
UK liquidation statistics by category
| Category | No. of liquidations | Percentage of liquidations (%) |
|---|---|---|
| 56101 - Licensed restaurants | 986 | 11.59% |
| 70229 - Management consultancy activities other than financial management | 961 | 11.3% |
| 41100 - Development of building projects | 857 | 10.07% |
| 62020 - Information technology consultancy activities | 609 | 7.16% |
| 68209 - Other letting and operating of own or leased real estate | 424 | 4.98% |
| 56302 - Public houses and bars | 356 | 4.18% |
| 41202 - Construction of domestic buildings | 336 | 3.95% |
| 56103 - Take-away food shops and mobile food stands | 336 | 3.95% |
| 68100 - Buying and selling of own real estate | 282 | 3.31% |
| 64209 - Activities of other holding companies n.e.c. | 281 | 3.3% |
(Source: The Liquidation Centre via Free Company Data)
Just under one in eight (11.59%) of companies that folded in 2025 were licensed restaurants, according to recent liquidation statistics.
This was followed by corporations engaged in management consultancy activities, excluding financial management (11.3%), and businesses in the development of building projects (10.07%).
Did you know?
Limited company liquidation is a formal insolvency process used to wind down a business.
There are many advantages of limited company liquidation, including debt relief, support for employees, guidance for your directors, and potential tax benefits.
For more information, read our guide to closing a limited company.
Family business failure rate statistics
As of 2023, there were approximately 5.13 million family businesses in the UK, accounting for 93.2% of all private enterprises.
Findings from The Family Business Research Foundation also show that:
- Over one million businesses (20.6%) have employees, with almost 3.2% employing more than 10 people, and around 0.5% with more than 50.
- Larger businesses are less likely to be family-owned: nearly four million (76.8%) have between one and nine employees, compared with 29.7% with 250 or more employees.
- Cumulatively, these businesses generate around -2,805 billion in turnover (nearly 50%) of the private sector's turnover.
- The gross value added (GVA) for family-owned businesses is approximately -985 billion.
- 57% of private-sector employment in the UK is in family-run businesses, amounting to 15.8 million jobs.
- For every -100 in turnover generated by UK family businesses, -17.50 was paid in tax. This resulted in total tax revenue of -422 billion as of 2023.
These stats highlight the continued resilience of the family business sector in the UK economy, especially given the recent economic climate.
That said, while some family businesses thrive, others barely survive or even fail.
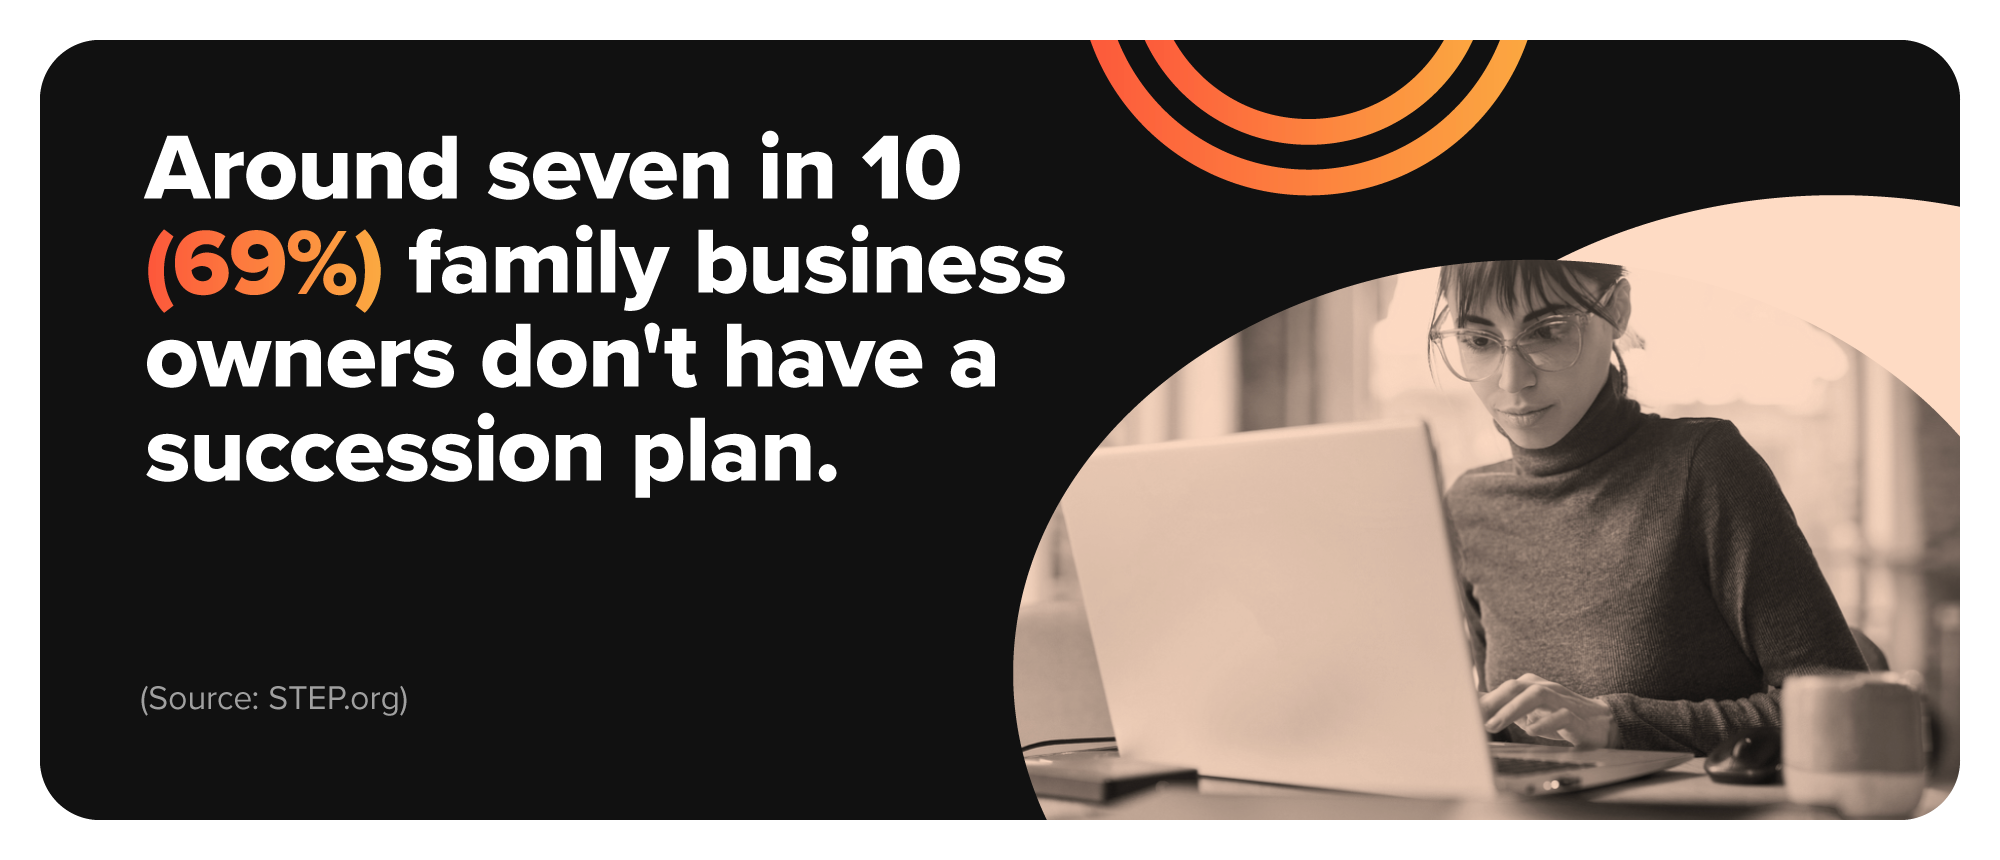
According to the most recent STEP Family Business Survey, almost seven in 10 (69%) family business owners don't have a succession plan in place detailing what will happen to their business and who will run it after their death.
In addition, just under a third (32%) of those surveyed have an up-to-date will.
The top three reasons given for not having a succession plan were:
- Haven't got around to it, but know that they should do it (27%)
- Don't need to do this yet, as there is plenty of time to plan (15%)
- Don't have a clear successor (14%)
When asked about their biggest fear of dying tomorrow without a succession plan, just 32% of family business owners felt their company might not continue to operate with the same core values, which could damage their legacy.
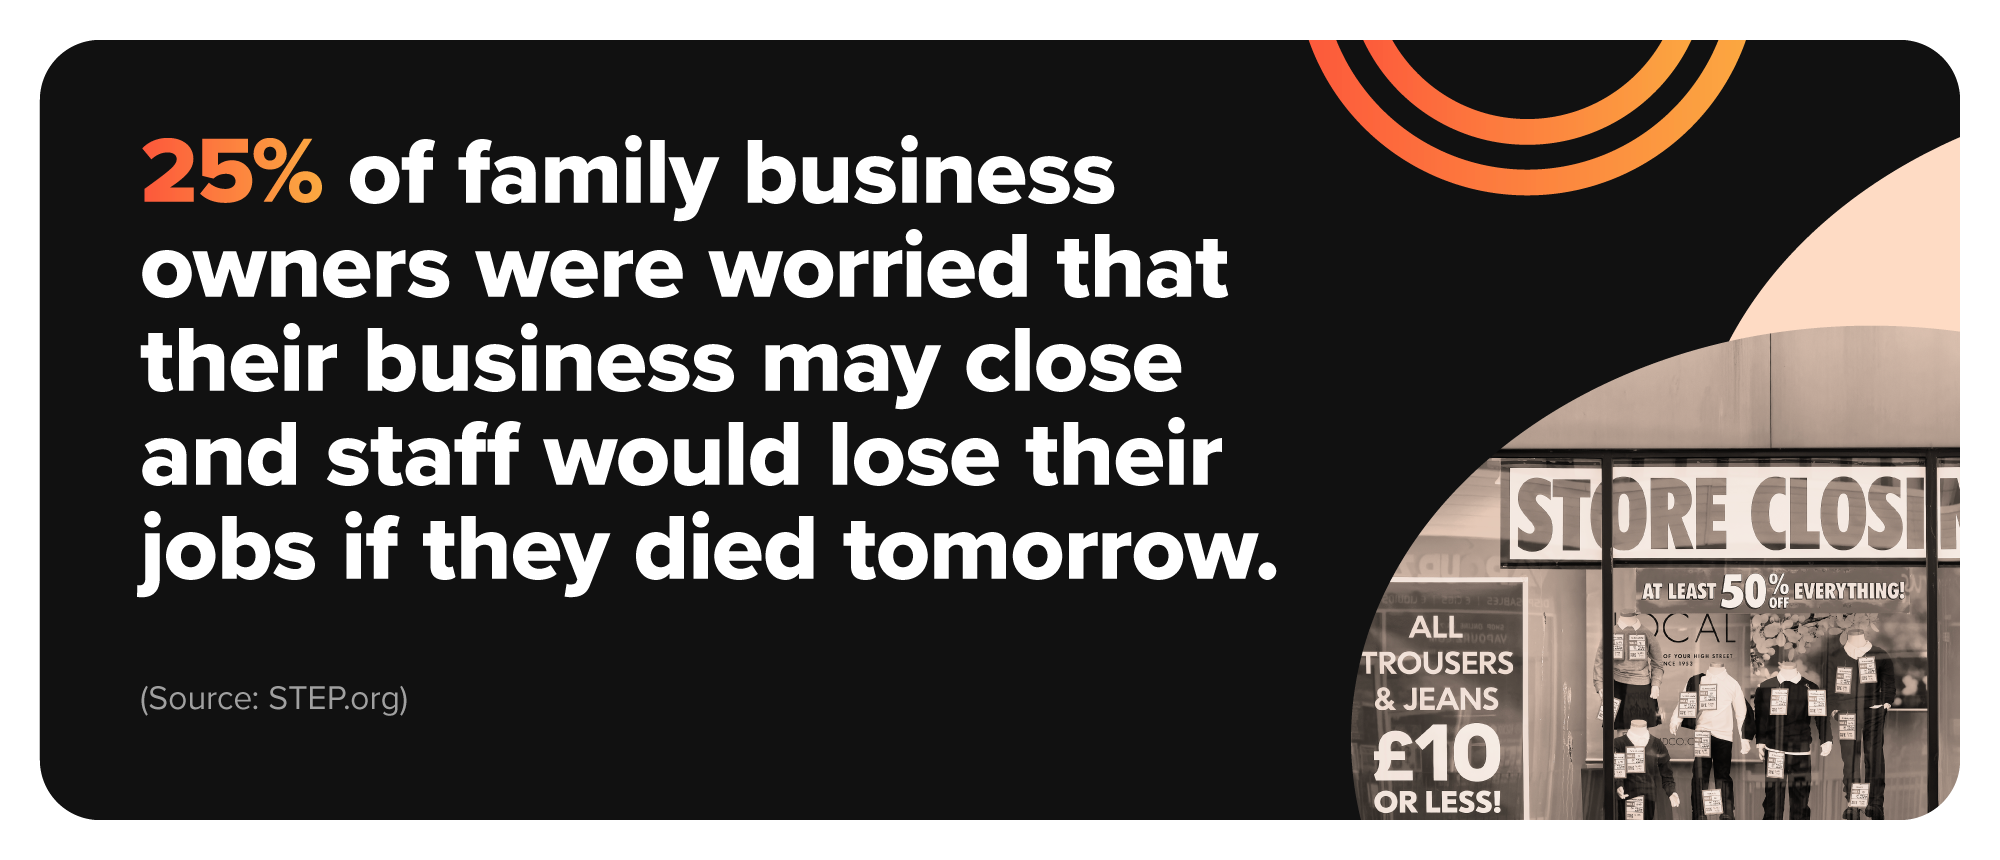
27% of businesses were fearful of family infighting and disagreements. A similar proportion were worried that their business might close and that staff would lose their jobs (25%), or that family members would be pushed out, thus no longer making it a family business (23%).
Overall, just 74% of those with a succession plan said this made their company stronger and helped them grow.
60% of family business owners wanted their company to remain within the family after their death, a figure that rose to 70% among those with a succession plan in place.
The growth and decline of family businesses over time (2010-25)
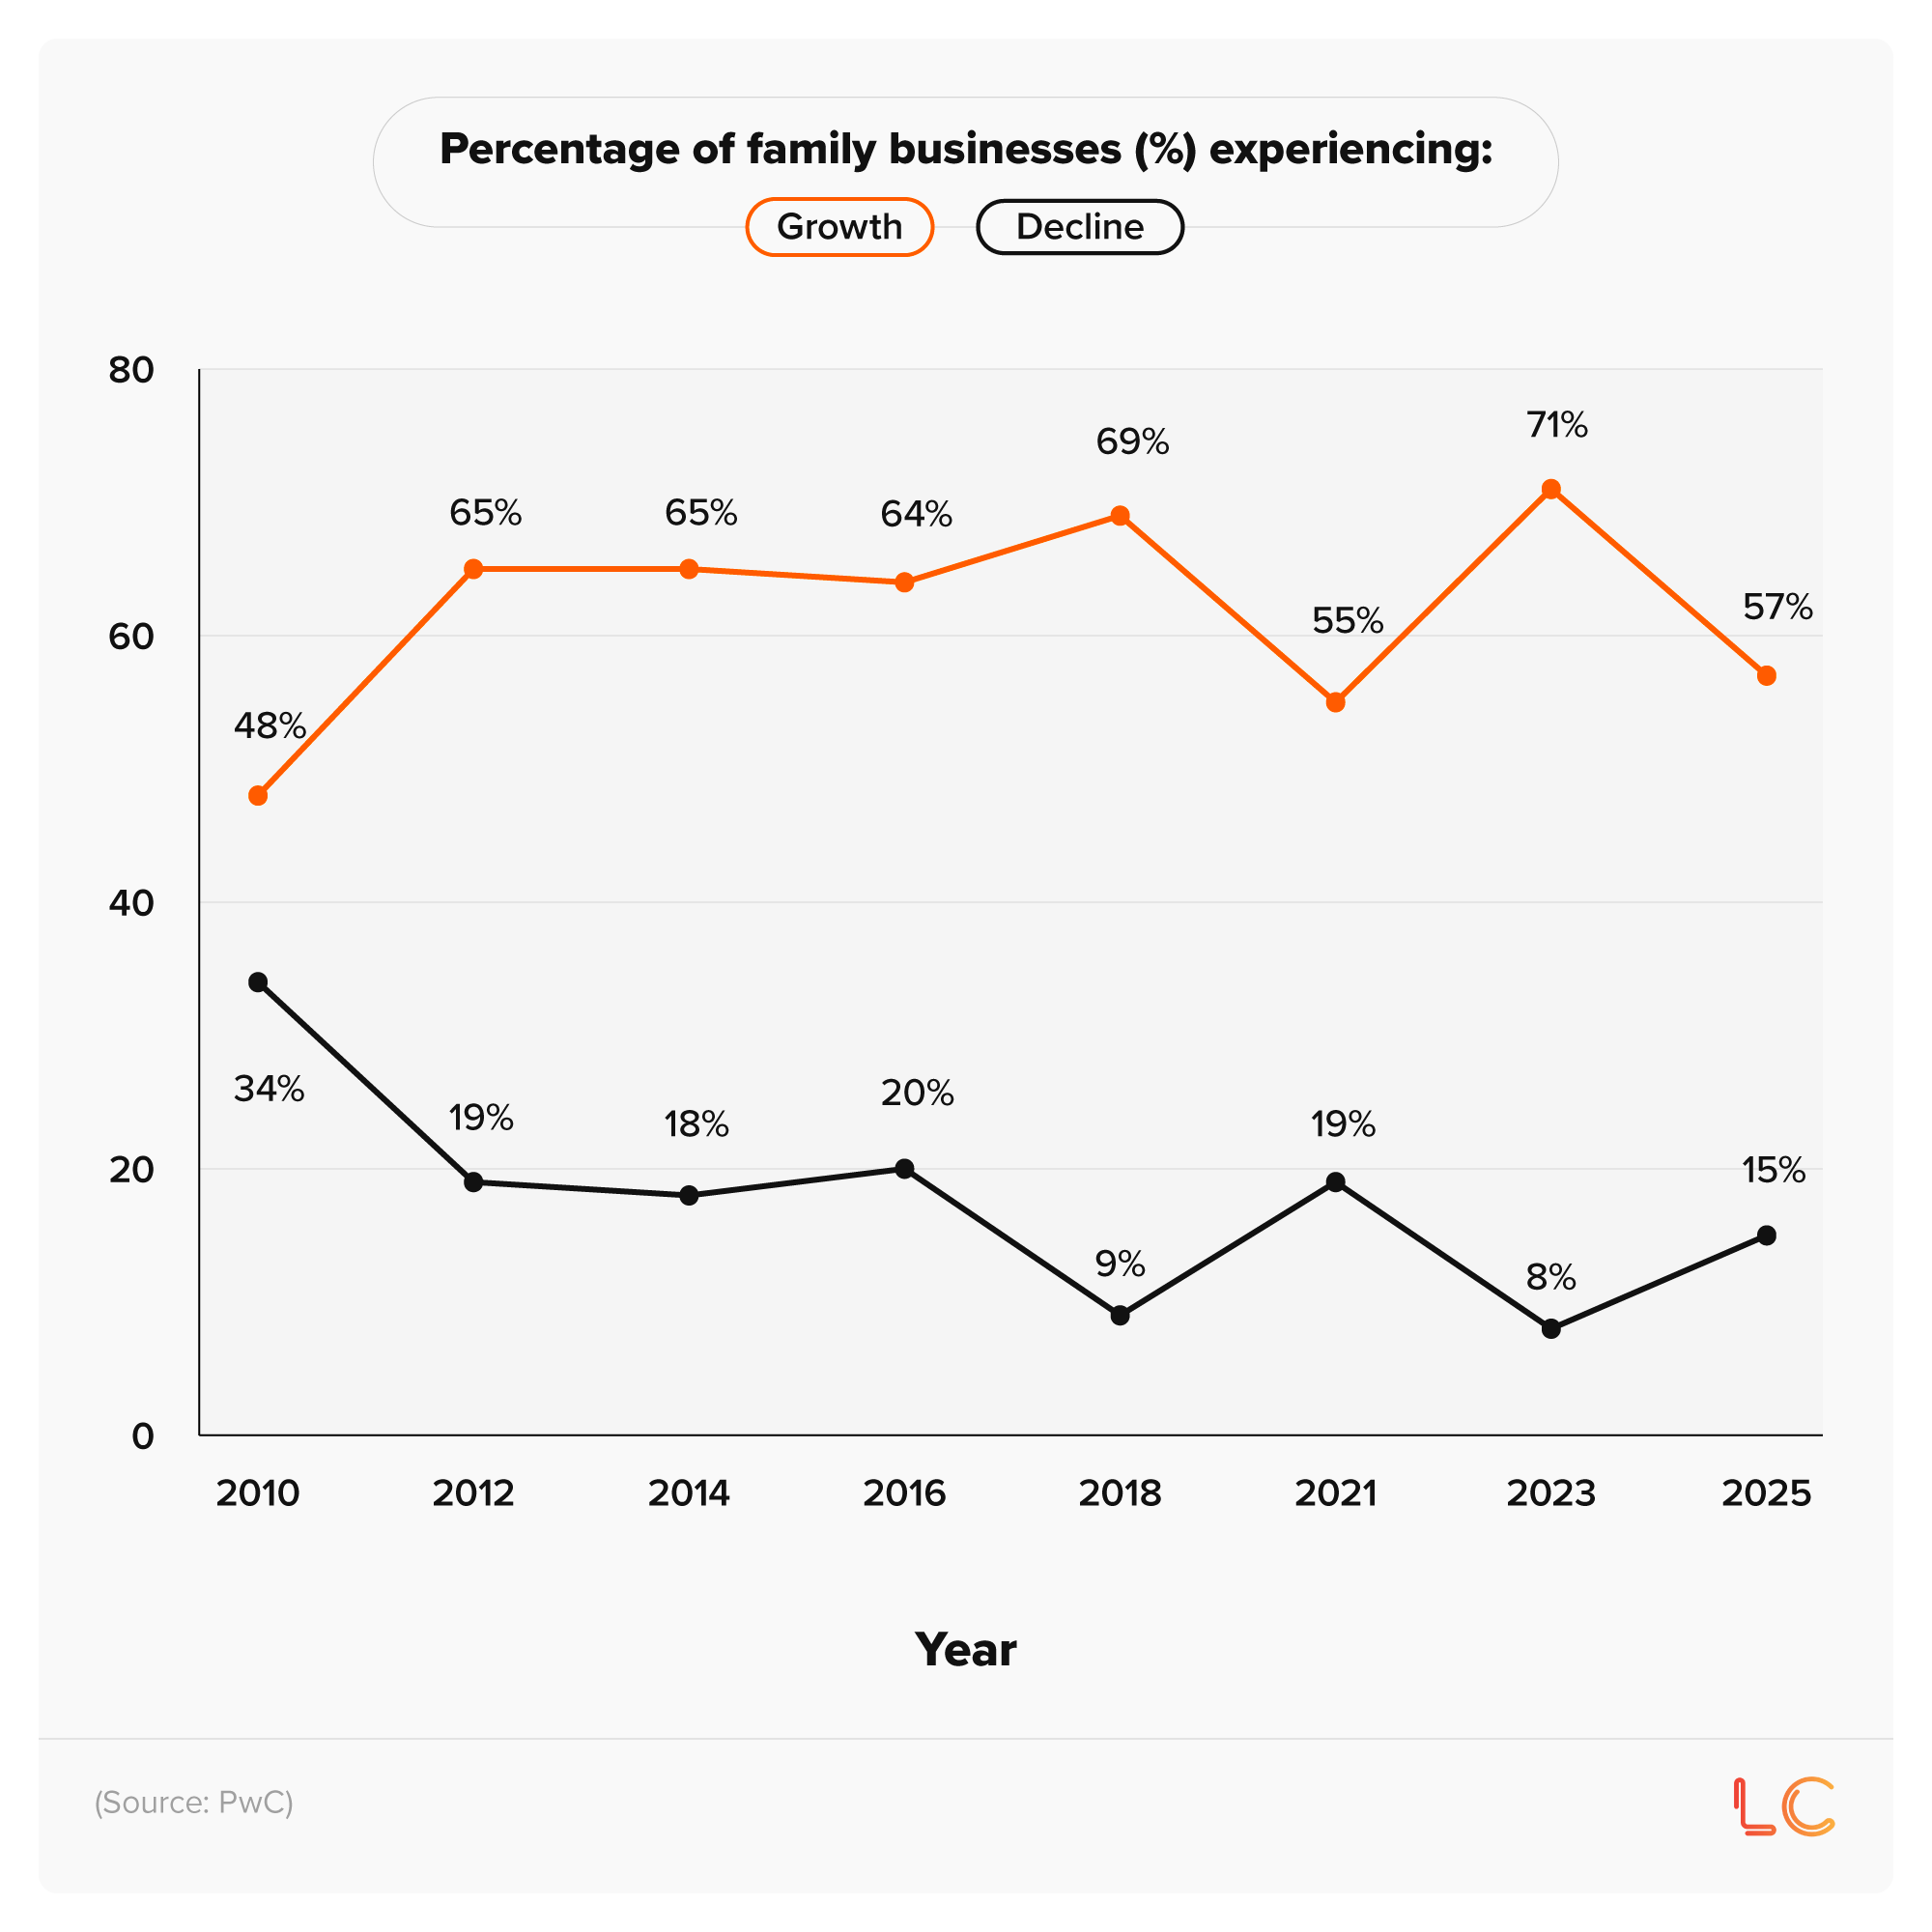
As of 2025, 15% of UK family businesses were experiencing some degree of financial decline. This is around double the proportion compared to 2023.
However, over the past 15 years, the percentage of family-run corporations reporting financial decline has decreased by more than half.
Back in 2010, 34% of UK family businesses were in financial decline. This figure dropped to 20% in 2016 and has fluctuated between 8% and 19% ever since.
The main ambitions of family businesses over time (2018-25)
Almost three-fifths (57%) of UK family businesses in 2025 said they aim to grow steadily in the coming years (a figure that has dropped by 11 percentage points since 2018).
The proportion of family businesses looking to stabilise their core business more than doubled between 2021 and 2025, from 11% to 23%.
Less than one in 20 family businesses surveyed by PwC in 2025 were looking to restructure or downsize to survive, a figure that has doubled in the past four years.
Most common responses by family businesses to market disruption or industry change
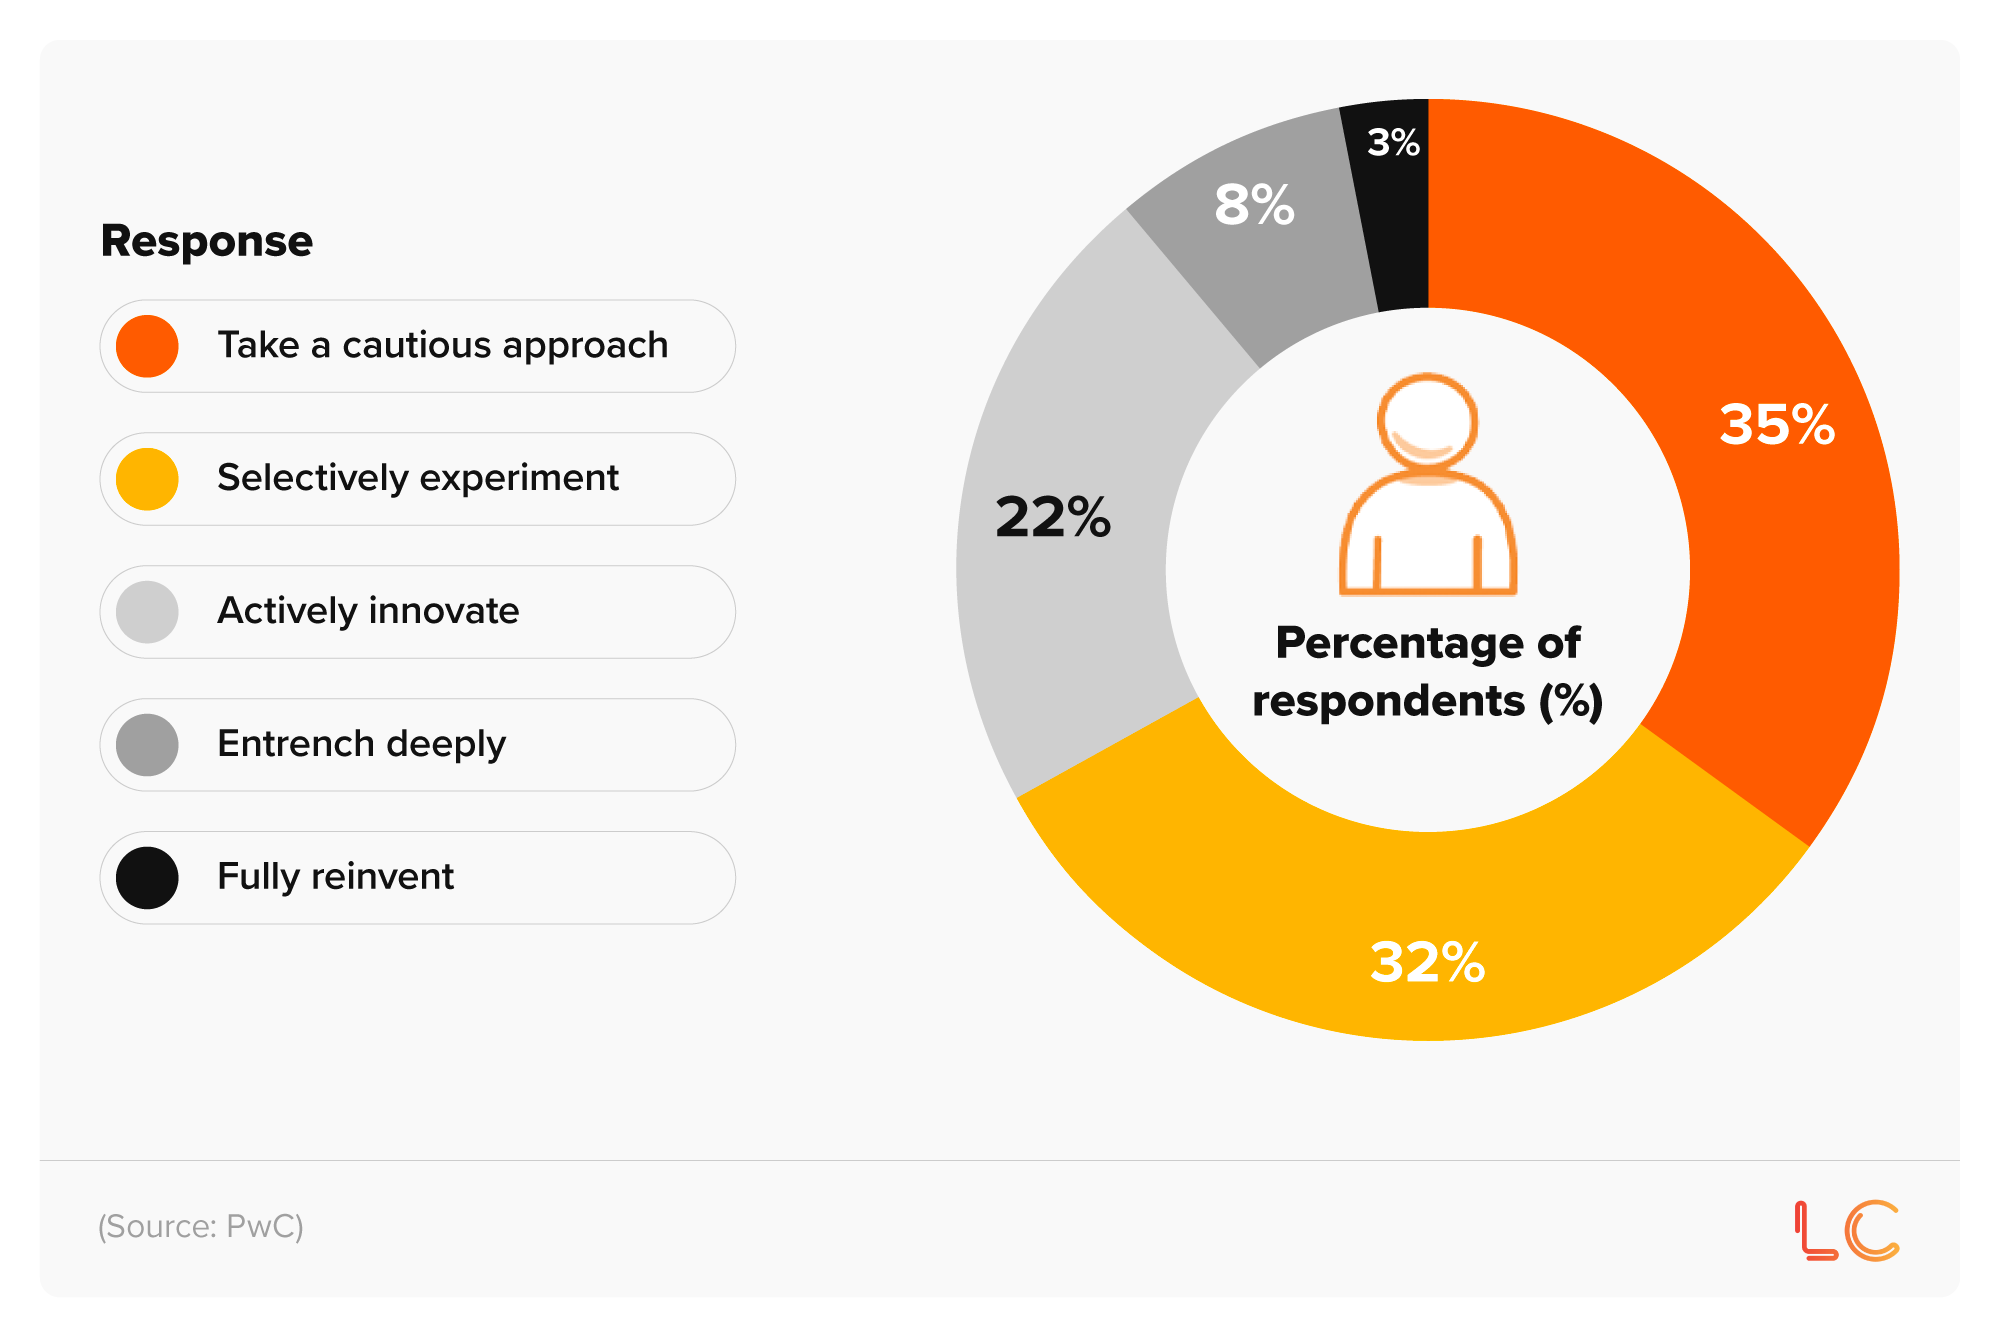
When it comes to market disruption or industry change, 35% of those questioned by PwC said they were adopting a cautious approach.
A similar percentage (32%) were looking to selectively experiment with their responses, with just 22% looking to actively innovate.
The greatest risks to the reputation of a family business
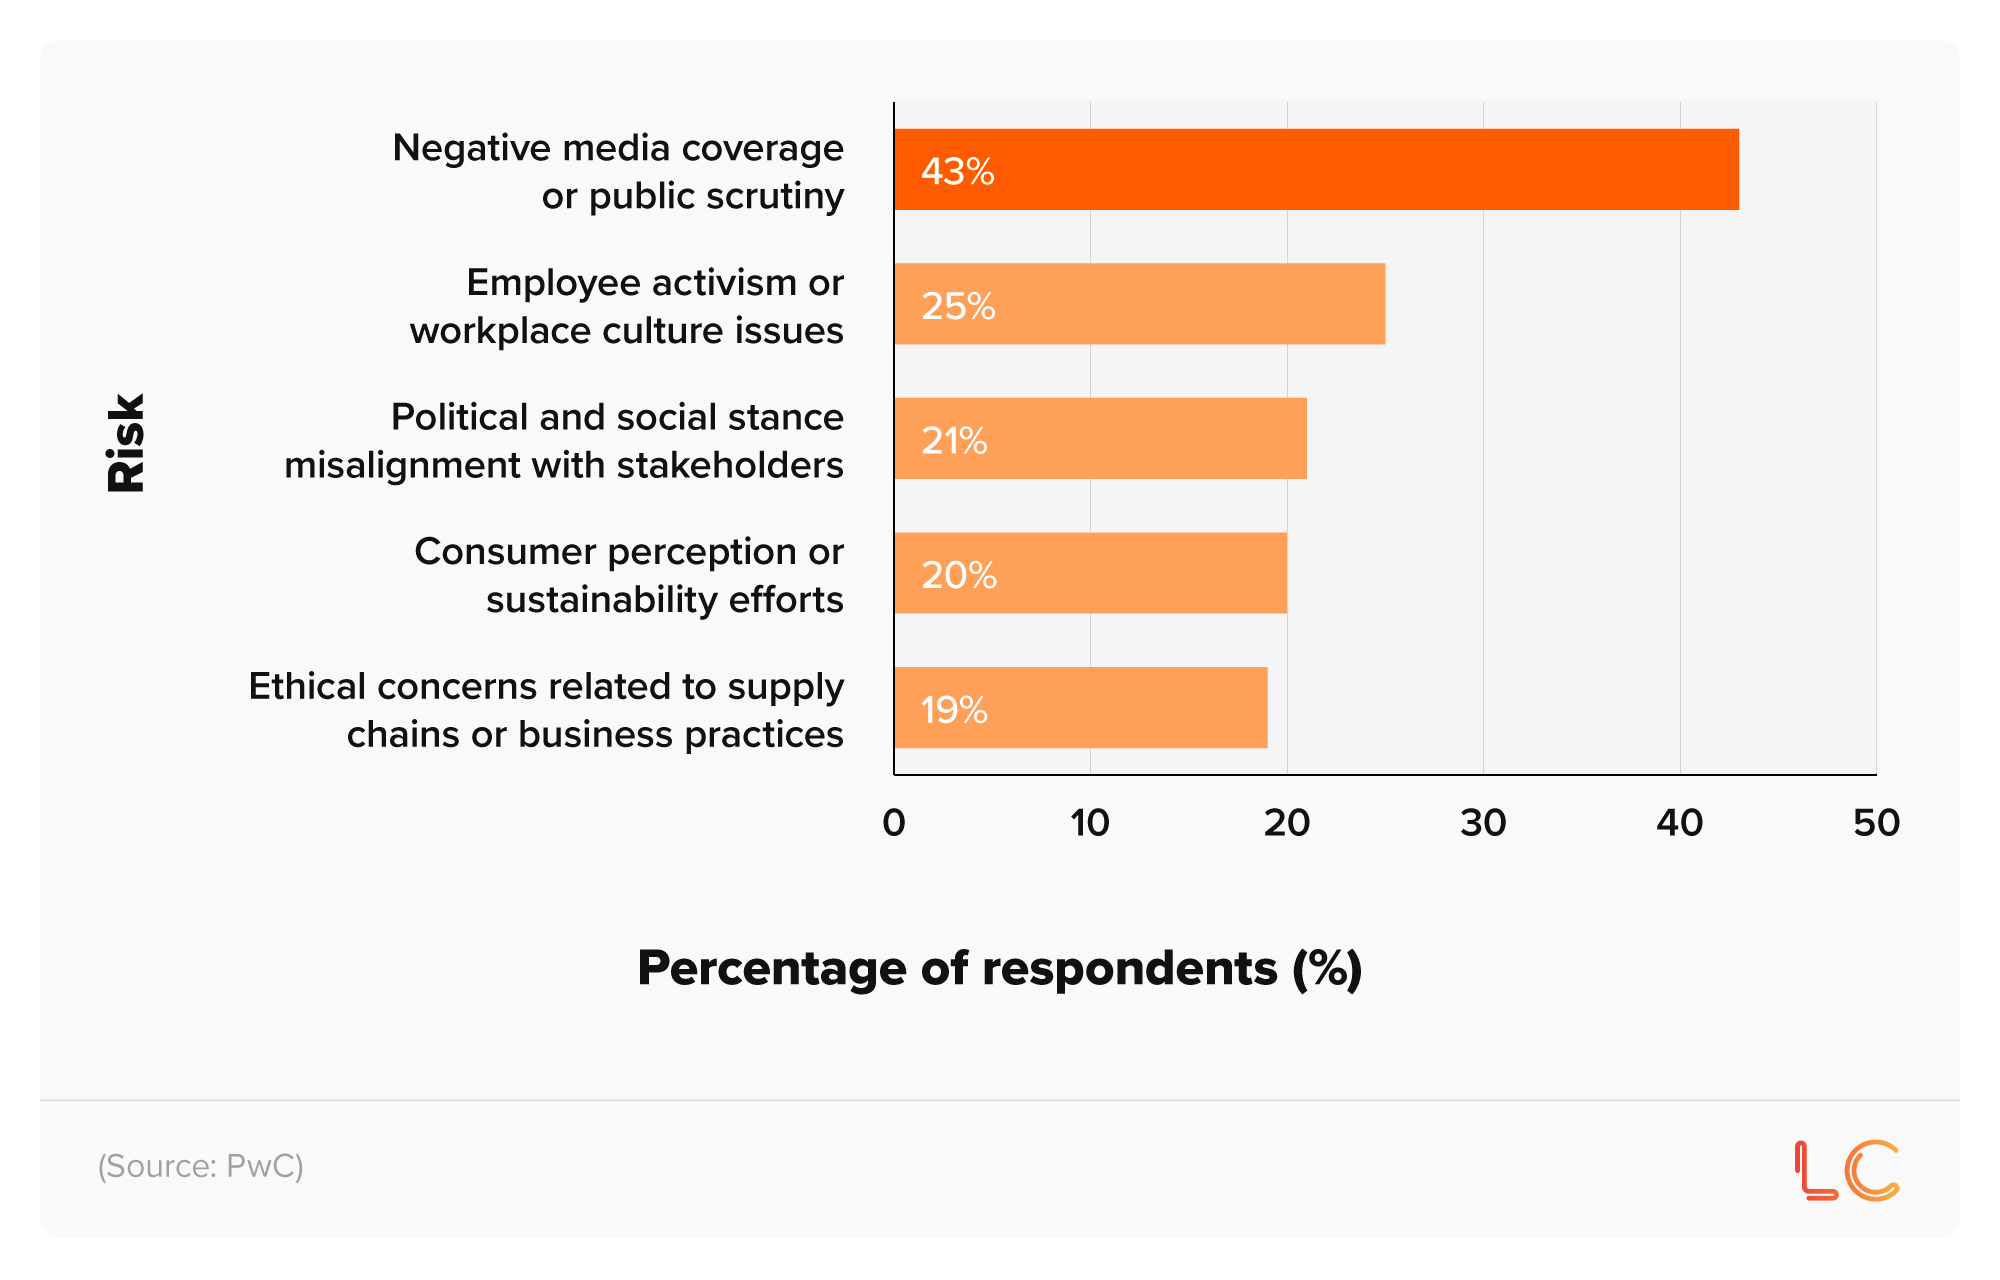
43% of family businesses believe negative media coverage or public scrutiny poses the greatest risk to their reputation. This is followed by 25% that claim employee activism or workplace cultural issues can significantly harm the company's image.
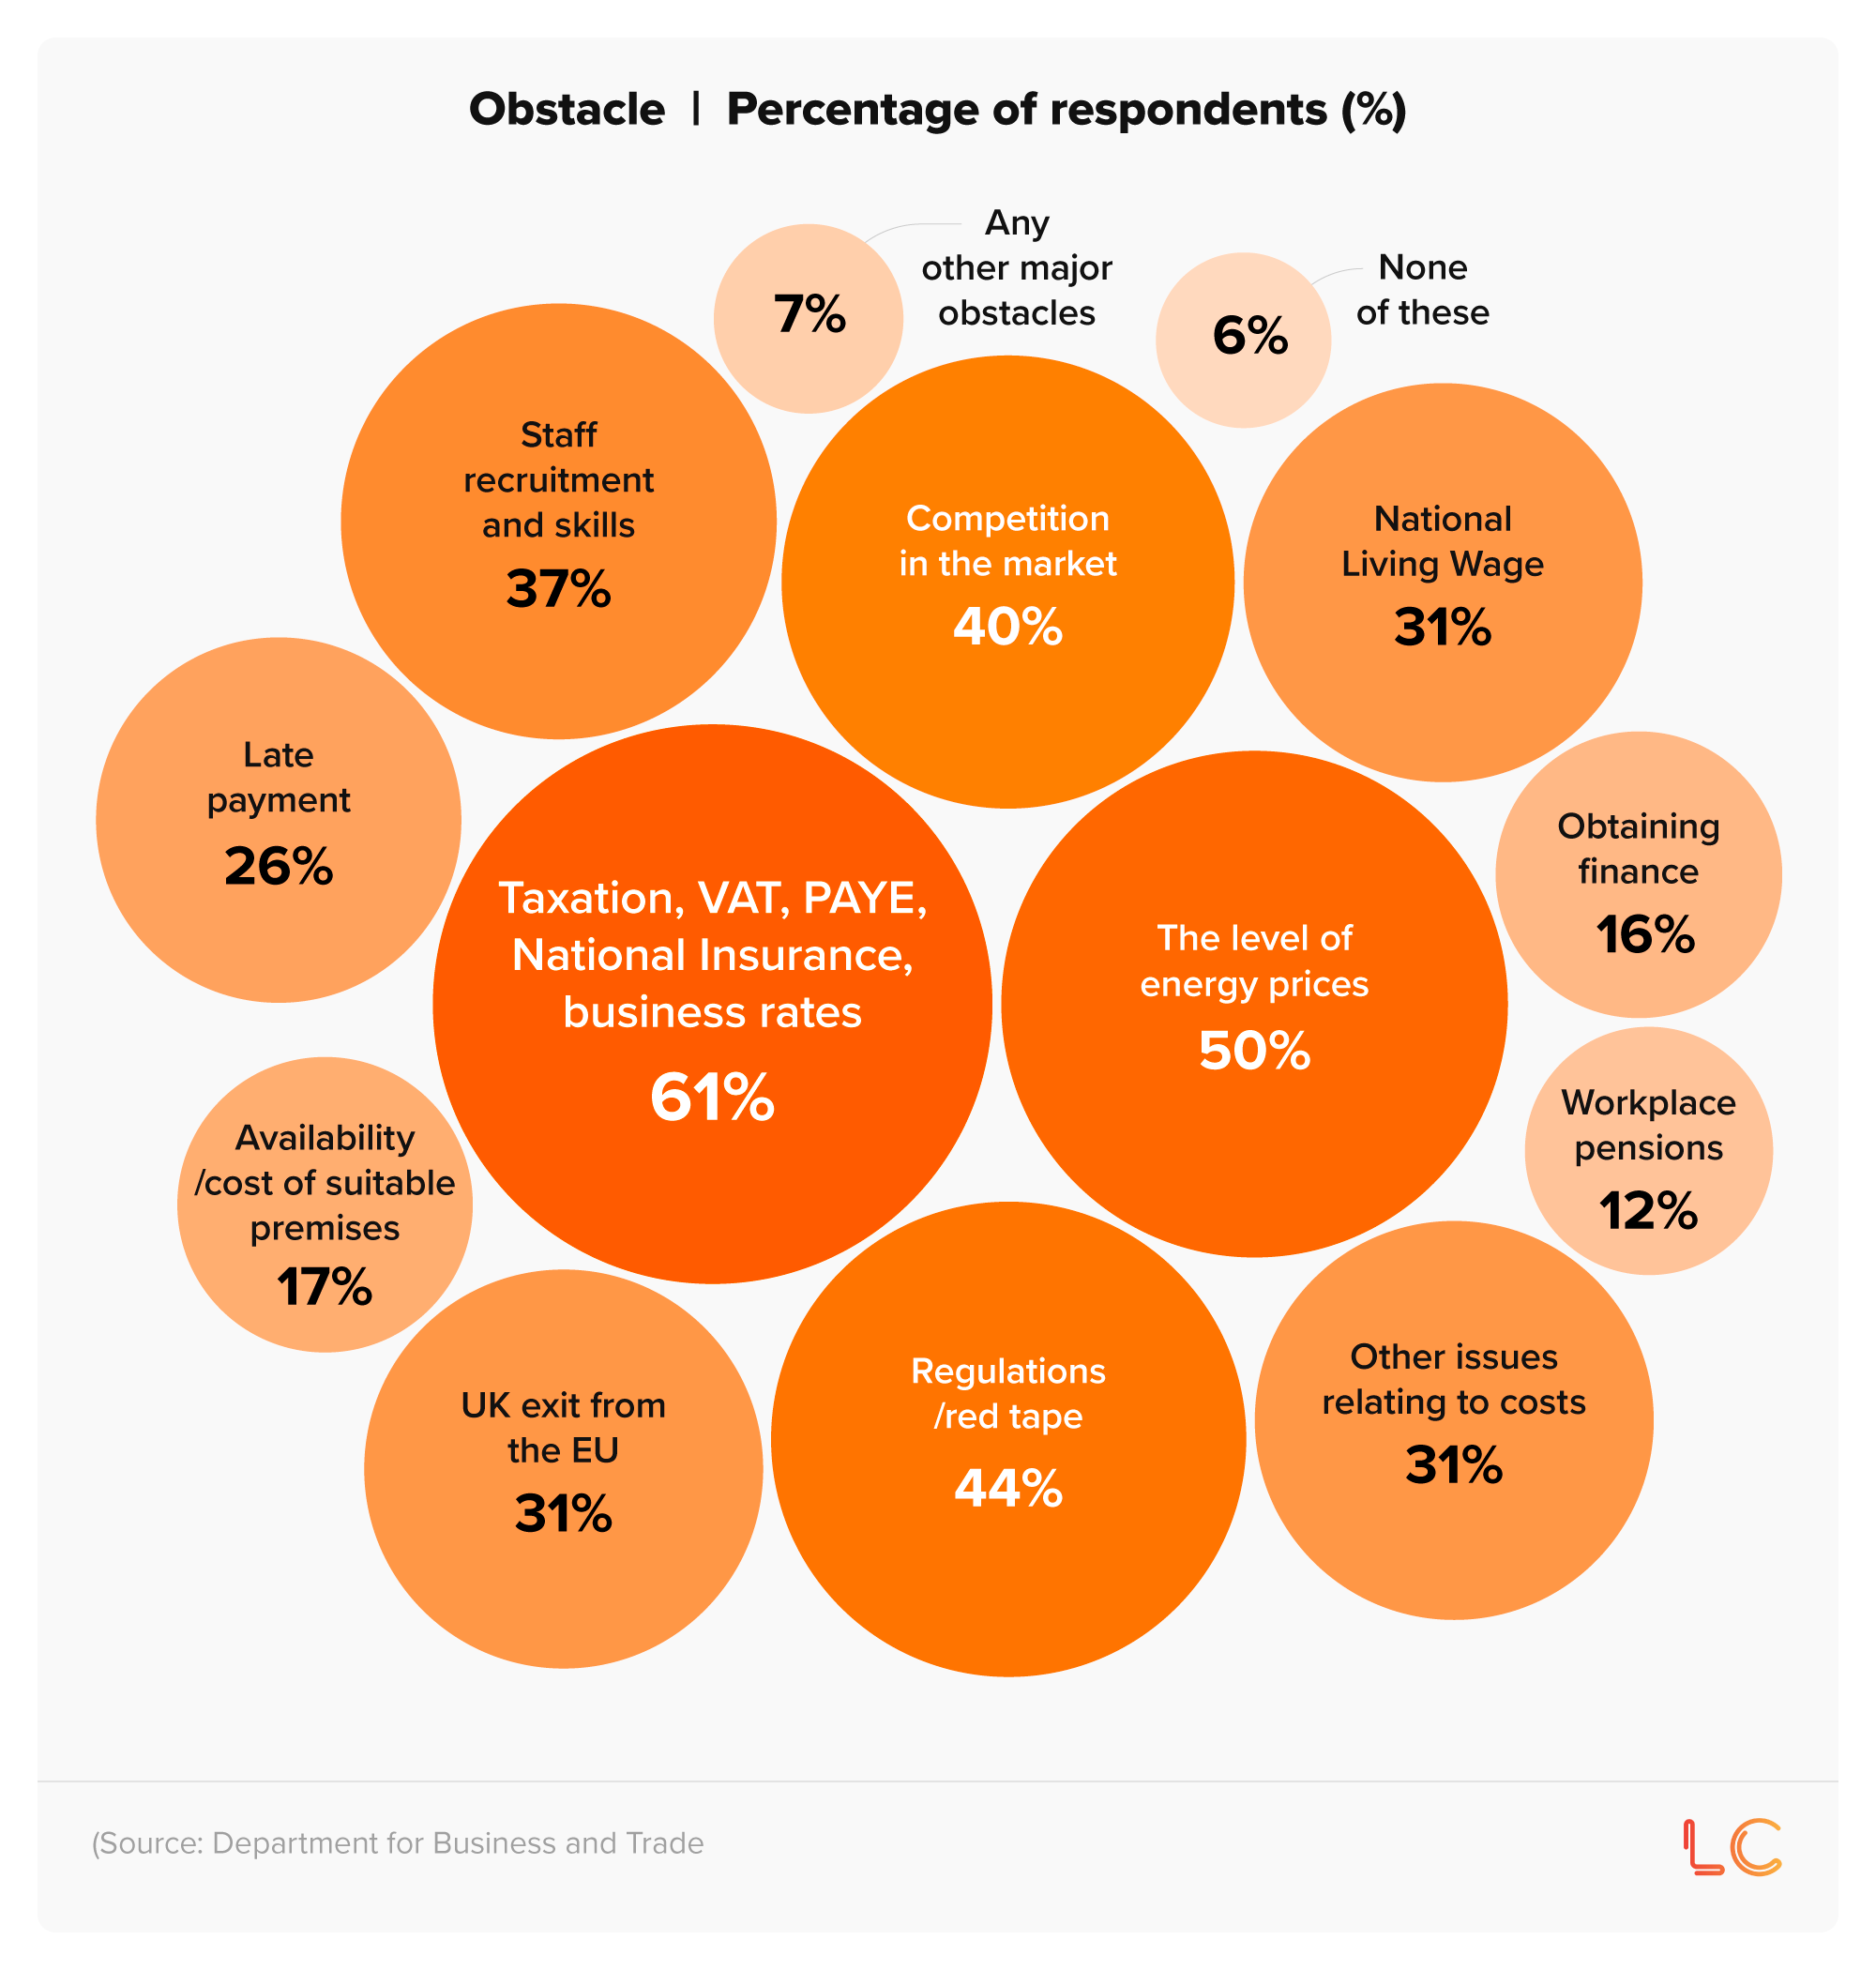
Most common reasons for business failure
61% of UK small businesses feel that financial factors (such as taxation, VAT, PAYE, National Insurance, and business rates) pose the greatest obstacle to their company.
Most common obstacles faced by small businesses
Our guide on signs your business is in trouble has further information.
Risk of insolvency statistics
More than two in five UK businesses (41.1%) feel that they are at a low risk of insolvency, with 28.9% believing they won't become insolvent.
Perceived risk of company insolvency by UK businesses
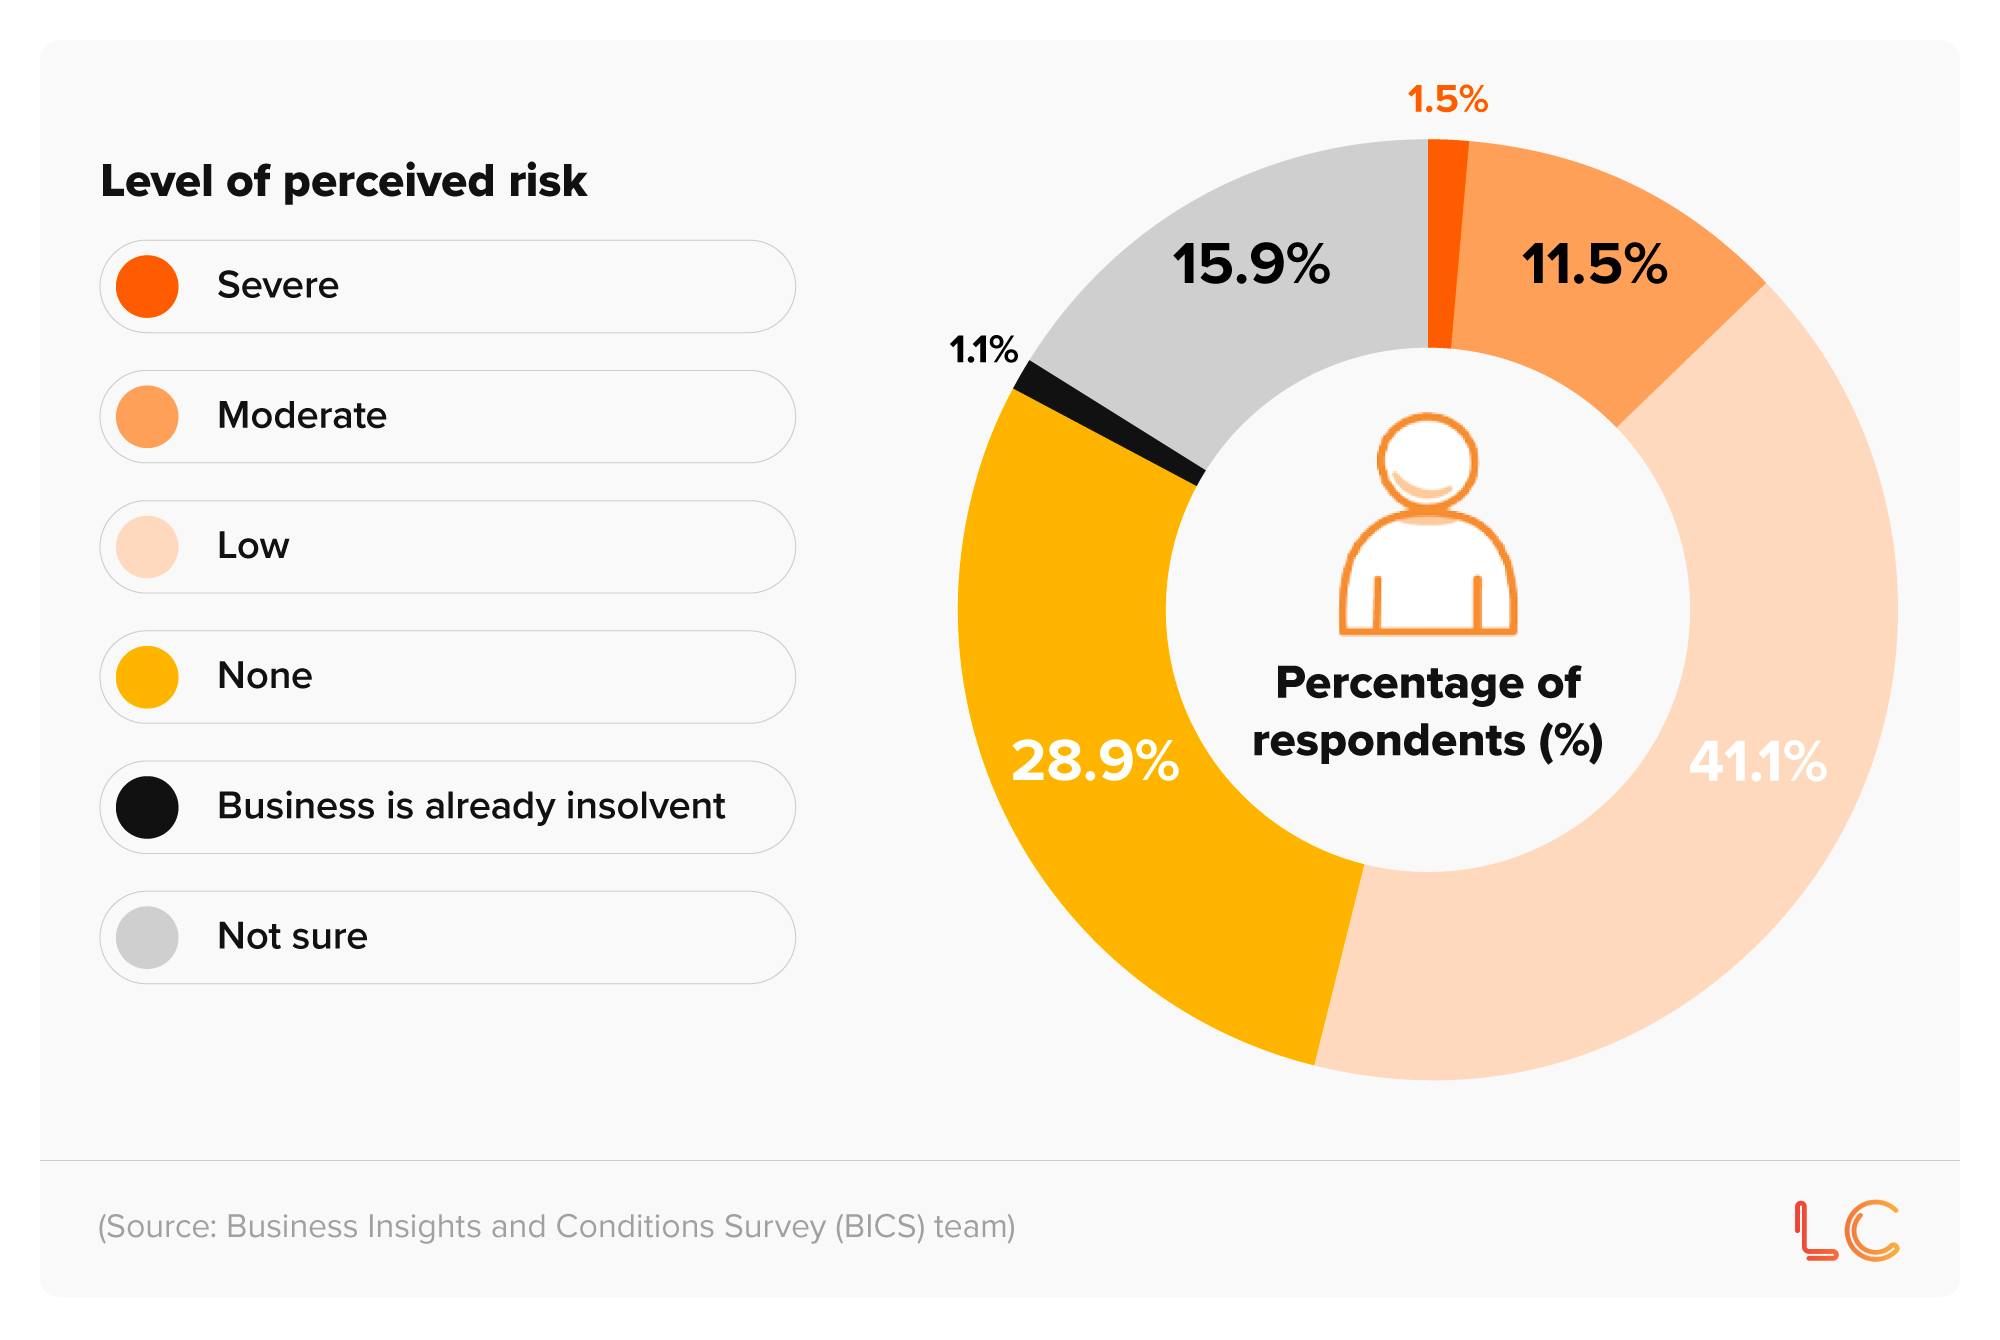
Conversely, 11.5% said there was a moderate risk of insolvency for their business, and 15.9% were unsure whether this would become an issue for them.
Perceived risk of company insolvency by different-sized UK businesses
| Level of perceived risk | 0-9 employees | 10-49 employees | 50-99 employees | 100-249 employees | 250+ employees |
|---|---|---|---|---|---|
| Severe | 1.4% | 2.3% | 1.0% | [c] | [c] |
| Moderate | 11.7% | 11.2% | 8.0% | 6.2% | 3.8% |
| Low | 40.3% | 47.2% | 49.6% | 48.9% | 48.4% |
| None | 29.0% | 27.2% | 31.3% | 35.1% | 33.7% |
| Business is already insolvent | [c] | [c] | [c] | [c] | [c] |
| Not sure | 16.4% | 11.9% | 9.7% | 9.1% | 13.3% |
(Source: Business Insights and Conditions Survey (BICS) team)Note: [c] represents data that has been removed for confidentiality reasons (such as percentages less than 1%, breakdowns with a count of 10 or less, and breakdowns with a micro business count between 1 and 10).
Typically, the perceived risk of insolvency decreases as the company's size increases.
For example:
- 11.7% of UK microbusinesses (i.e., those with fewer than 10 employees) felt a moderate level of insolvency risk, compared with 3.8% of those with more than 250 employees.
- 40.3% of UK microbusinesses believed their risk of insolvency was low, compared to almost half for all other-sized businesses.
- 27.2% of companies with 10-49 employees said there was no risk of insolvency, a figure that rose to 35.1% for those with 100-249 workers.
Richard Hunt, Insolvency Practitioner at Liquidation Centre, said:
"Larger companies generally feel more secure because they have stronger cash reserves, more stable revenue streams and better access to financial support, which helps explain why perceived insolvency risk declines as business size increases.
Smaller firms, especially microbusinesses, often run on tighter margins and have less room to absorb unexpected costs or drops in income, so they naturally report higher levels of concern. The fact that many businesses report little or no risk can reflect good financial management, steady demand and a clear understanding of their future pipeline.
However, there is a danger in becoming too confident, as even healthy businesses can run into problems if they underestimate rising costs, fail to monitor cashflow or overlook early warning signs. Staying aware of their financial position is essential, regardless of size, because complacency can quickly turn a low-risk situation into a more serious one."
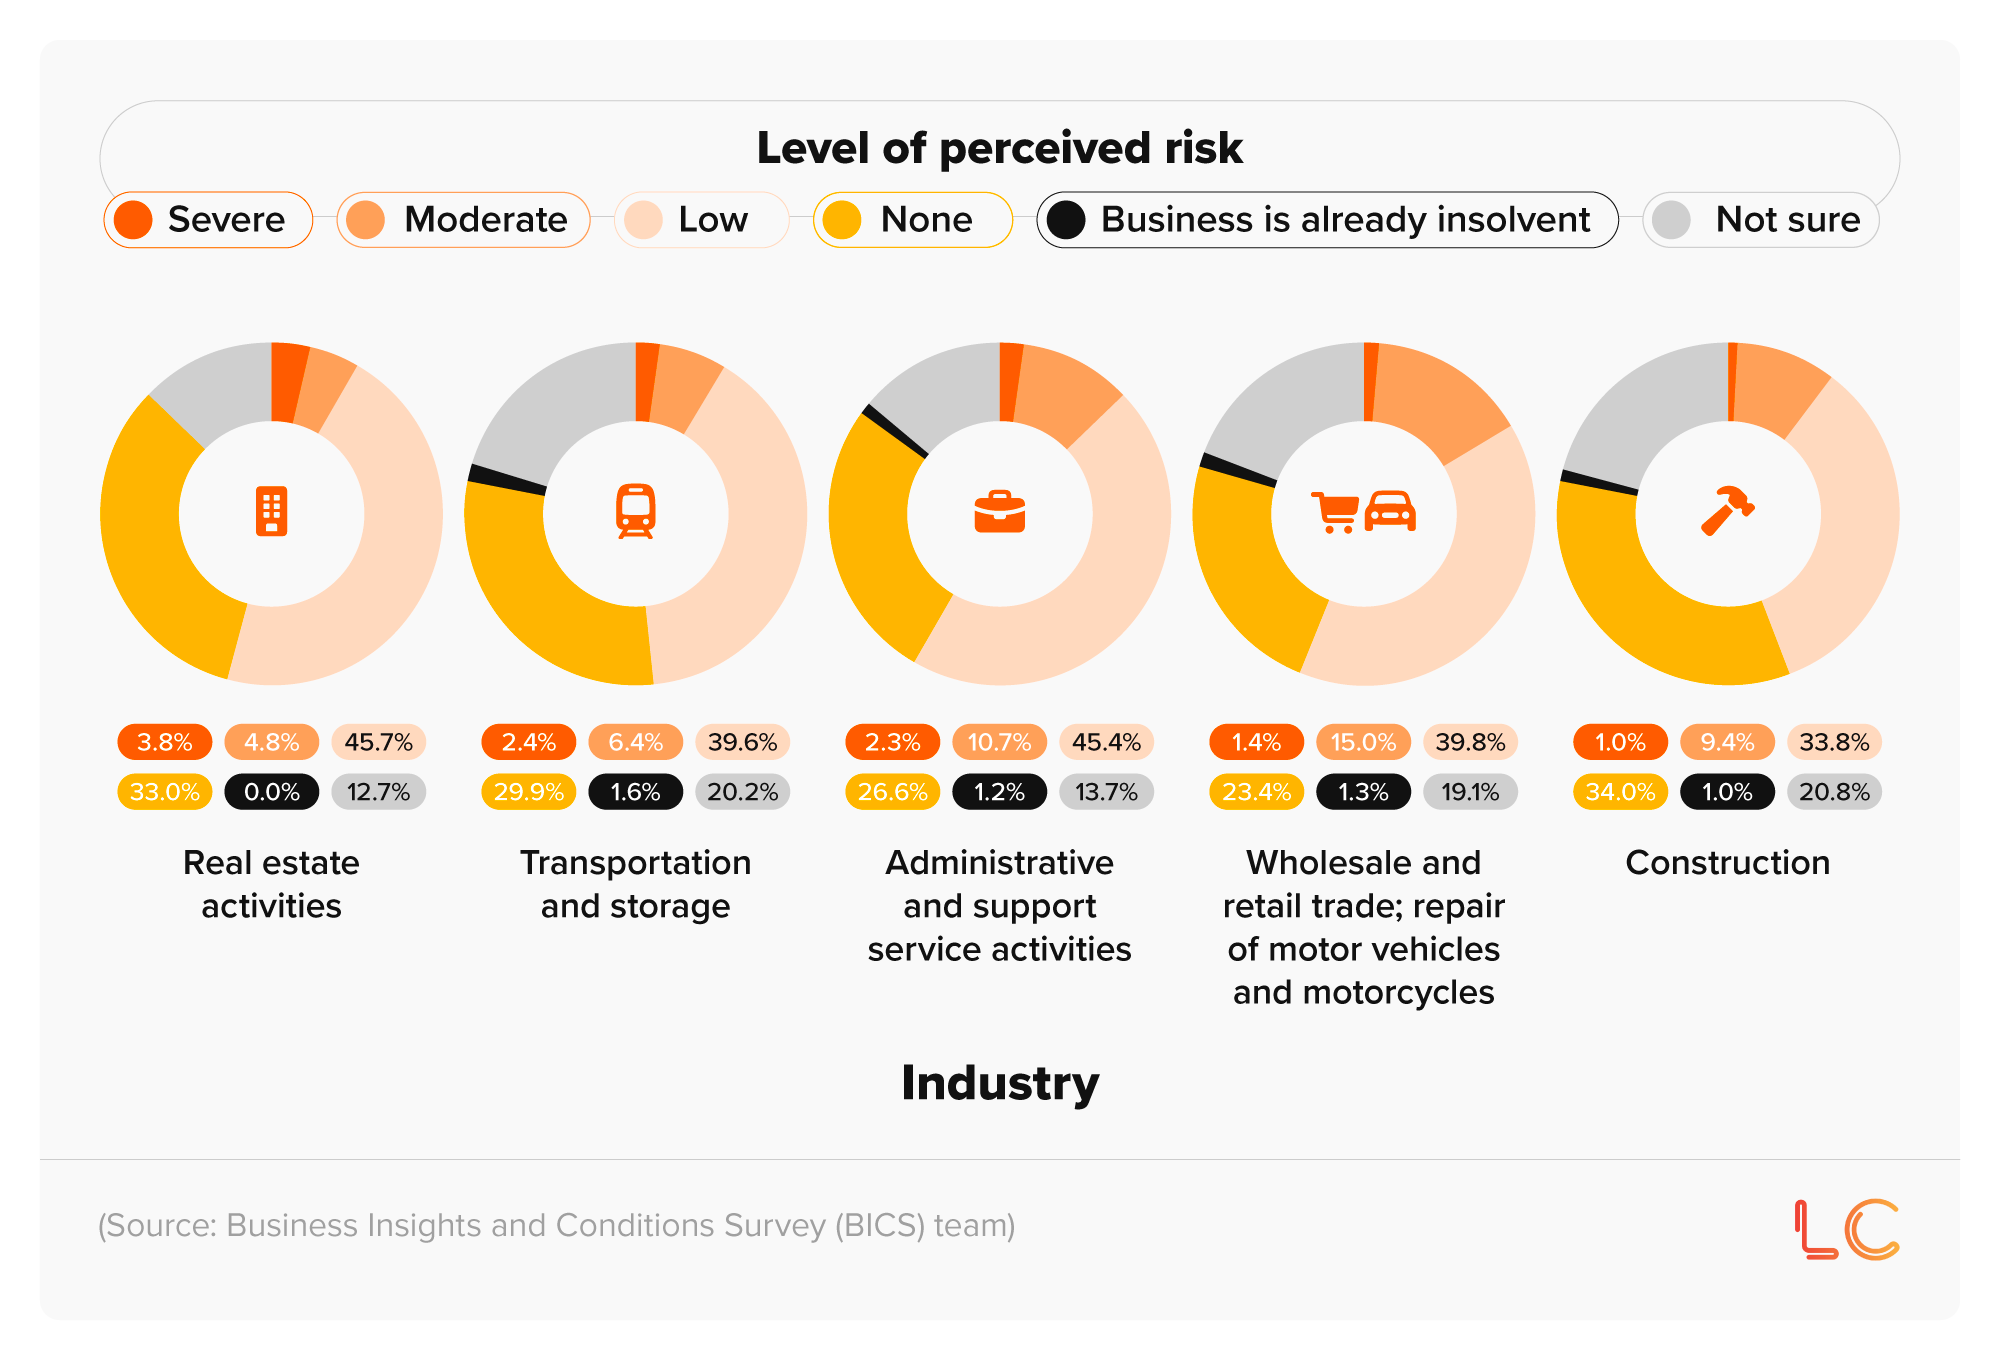
Perceived risk of company insolvency by UK businesses in different sectors
| Industry | Severe | Moderate | Low | None | Business is already insolvent | Not sure |
|---|---|---|---|---|---|---|
| Manufacturing | 3.3% | 12.7% | 48.4% | 25.8% | [c] | 9.7% |
| Water supply, sewerage, waste management, and remediation activities | [c] | [c] | [c] | [c] | [c] | [c] |
| Accommodation and food service activities | 3.0% | 23.2% | 37.5% | 24.4% | [c] | 11.9% |
| Information and communication | 2.0% | 13.8% | 38.0% | 30.4% | [c] | 15.0% |
| Professional, scientific, and technical activities | [c] | 9.2% | 48.8% | 30.8% | 1.4% | 9.4% |
| Education | [c] | 9.0% | 37.3% | 48.9% | 0.0% | 4.5% |
| Human health and social work activities | [c] | 7.8% | 36.8% | 33.9% | 0.0% | 21.2% |
| Arts, entertainment, and recreation | 0.0% | 5.8% | 24.2% | 33.8% | 2.8% | 33.4% |
| Other service activities | [c] | 3.2% | 56.6% | 16.5% | 3.9% | 19.6% |
(Source: Business Insights and Conditions Survey (BICS) team)Note: [c] represents data that has been removed for confidentiality reasons (such as percentages less than 1%, breakdowns with a count of 10 or less, and breakdowns with a micro business count between 1 and 10).
According to recent insolvency statistics, those working in accommodation and food service activities tend to have the highest perceived risk of insolvency. In all, 26.2% have a severe or moderate belief that their business will fold in the near future. This is followed by 16.4% of those working in the wholesale and retail trade; repair of motor vehicles and motorcycles.
Conversely, 56.6% of companies in other service industries have a low perceived risk of insolvency, followed by just under half from the professional, scientific, and technical sector (48.8%) and manufacturing (48.4%).
Incidentally, a similar percentage (48.9%) of those in the education industry believe their businesses face no risk of insolvency. This figure is around three times the value for those working in other service activities.
Perceived risk of company insolvency by UK businesses in different regions
| Region | Severe | Moderate | Low | None | Business is already insolvent | Not sure |
|---|---|---|---|---|---|---|
| Northern Ireland | 0.0% | 5.2% | 45.9% | 36.7% | [c] | 11.8% |
| Scotland | [c] | 4.3% | 48.9% | 33.0% | [c] | 13.0% |
| Wales | [c] | 5.4% | 50.4% | 31.5% | [c] | 11.4% |
| England | [c] | 7.4% | 48.1% | 32.2% | [c] | 10.9% |
| South West | [c] | 7.3% | 50.5% | 30.1% | [c] | 10.7% |
| South East | [c] | 7.1% | 47.7% | 32.9% | [c] | 11.2% |
| London | [c] | 5.8% | 45.1% | 32.9% | 1.0% | 14.6% |
| East of England | [c] | 6.1% | 46.5% | 33.3% | [c] | 12.8% |
| West Midlands | [c] | 4.9% | 48.9% | 32.9% | [c] | 12.1% |
| East Midlands | [c] | 5.3% | 47.0% | 33.6% | [c] | 13.1% |
| Yorkshire and the Humber | [c] | 6.0% | 48.0% | 33.8% | [c] | 10.9% |
| North West | 1.0% | 5.3% | 48.6% | 33.4% | [c] | 11.3% |
| North East | [c] | 6.0% | 46.6% | 34.4% | [c] | 11.7% |
| UK | [c] | 7.3% | 48.2% | 32.1% | [c] | 11.0% |
(Source: Business Insights and Conditions Survey (BICS) team)
On average, just under half (48.2%) of UK businesses feel there is a low risk of insolvent liquidation, with 32.1% believing the chance of them folding is zero.
Risk of insolvency stats across the UK tend to be highest in England, specifically the South West and South East, where 7.3% and 7.1% of respective businesses feel a moderate risk of insolvency.
More than half in Wales (50.4%) and the South West of England (50.5%) feel the risk of insolvency is low, while more than a third (36.7%) of companies in Northern Ireland do not fear insolvency at all.
For more information, check out our guide on what it means to be insolvent, the signs to look out for, and how best to manage the situation.
UK business insolvency statistics
UK business insolvency statistics over time
There were 25,418 business insolvencies across the UK in 2024. The majority of them (93.9%) were based in England.
Business insolvency statistics show a gradual increase in the number of UK companies going bust, rising by almost two-thirds (64%) over 10 years.
Number of company insolvencies in the UK over time (2015-24)
A slight decrease between 2019 and 2020 can be attributed to the COVID-19 pandemic, when overall UK figures dropped to 13,421 and 14,913, respectively. However, the number of UK business insolvencies each year since 2022 has remained above 23,000.
UK business insolvency statistics by industry
Between 2015 and 2024, there were 32,862 insolvencies relating to businesses in the construction industry, the most across any sector during this period. This rose from 2,628 in 2015 to 4,244 in 2024 (a 61.5% increase over 10 years).
Number of company insolvencies in Britain by industry over time (2015-24)
This was followed by businesses in wholesale and retail trade (repair of motor vehicles and motorcycles). With 26,632 insolvencies from 2015 to 2024, this represented a 63.4% increase in business insolvencies across the decade.
UK business insolvency rate over time
As of 2024, the UK's company insolvency rate ranged from 52.5 per 10,000 companies in England and Wales to 36.2 per 10,000 companies in Northern Ireland.
England's company insolvency rate has generally grown over time, rising from 42.4 per 10,000 in 2017 to a peak of 57.2 per 10,000 in 2023.
Company insolvency rate in the UK over time (2015-24)
However, the rate of company insolvency in Scotland fluctuated during this time, from a high of 57.1 per 10,000 in 2016 to a low of 30.4 per 10,000 in 2020, and then back up again to 53.7 per 10,000 in 2023.
Northern Ireland followed a similar pattern, reaching a peak of 58.5 per 10,000 in 2019, then dipping to 15.6 per 10,000 in 2021, before rising again to 36.2 per 10,000 in 2024.
UK compulsory liquidation statistics
UK compulsory liquidation statistics over time
According to recent liquidation statistics, there were 3,837 compulsory liquidations in the UK in 2024. Almost 85% of these were for companies located in England and Wales.
Number of compulsory liquidations in the UK over time (2015-24)
Overall, the number of UK compulsory liquidations remained fairly steady between 2015 and 2024, at around 3,200 to 3,800 a year. However, this figure dropped significantly during the COVID years to 1,686 in 2020 and 653 in 2021.
UK compulsory liquidation rate statistics
Between 2015 and 2024, the compulsory liquidation rate in England and Wales fluctuated between a low of 1.2 per 10,000 in 2021 and a high of 9.4 per 10,000 in 2015.
Since 2021, this figure has risen YoY to 7.1 per 10,000 as of 2024.
Scotland and Northern Ireland have followed suit, with the former reaching a compulsory liquidation rate of 33.2 per 10,000 in 2015 (more than three times the rate of England and Wales). A low of 6.5 per 10,000 was achieved in 2021, before subsequent YoY increases to 20.1 per 10,000 in 2024.
Compulsory liquidation rate in the UK over time, per 10,000 (2015-24)
| Year | England and Wales | Scotland | Northern Ireland |
|---|---|---|---|
| 2015 | 9.4 | 33.2 | - |
| 2016 | 8.8 | 32.5 | - |
| 2017 | 8.0 | 25.3 | - |
| 2018 | 8.7 | 26.8 | - |
| 2019 | 7.9 | 30.9 | 36.9 |
| 2020 | 3.5 | 13.2 | 8.6 |
| 2021 | 1.2 | 6.5 | 2.8 |
| 2022 | 4.6 | 10.7 | 6.9 |
| 2023 | 6.5 | 19.1 | 10.0 |
| 2024 | 7.1 | 20.1 | 14.5 |
(Source: The Insolvency Service)Note: Data for Northern Ireland are only available for 2019-24.
Northern Ireland's compulsory liquidation rate reached its peak in 2019, at 36.9 per 10,000 companies (the highest recorded rate across all nations between 2015 and 2024).
Despite recording a rate of 3.2 per 10,000 businesses in 2021, subsequent YoY increases have raised the compulsory insolvency rate to 14.5 per 10,000 corporations as of 2024.
Note: Compulsory liquidations are also known as HMRC liquidations and occur when HMRC petitions the Courts to close your business down due to unpaid taxes.
UK Creditors' Voluntary Liquidation (CVL) statistics
UK CVL statistics over time
The number of CVLs in the UK reached 19,465 in 2024. The vast majority of these (96.8%) were based in England and Wales.
Number of CVLs in the UK over time (2015-24)
This total figure for 2024 represents a 7.8% decrease from the previous year but is almost double the amount compared to 2015, 2016, and 2017.
Did you know?
To dissolve a company through a CVL, you'll need to nominate an Insolvency Practitioner (IP). The cost of a CVL is determined by the fees incurred at the pre- and post-appointment stages and can vary on a case-by-case basis.
UK CVL rate statistics
The UK's CVL rate has fluctuated over time, depending on which part of the country you're looking at.
For example, the rate of voluntary liquidation in England and Wales reached a peak of 46.7 per 10,000 in 2023, compared to 34.6 per 10,000 in Scotland and 19.8 per 10,000 in Northern Ireland throughout 2022.
CVL rate in the UK over time, per 10,000 (2015-24)
| Year | England and Wales | Scotland | Northern Ireland |
|---|---|---|---|
| 2015 | 32.5 | 14.7 | - |
| 2016 | 30.8 | 15.6 | - |
| 2017 | 29.7 | 14.7 | - |
| 2018 | 31.3 | 18.4 | - |
| 2019 | 32.6 | 15.2 | 15.2 |
| 2020 | 24.4 | 13.3 | 9.7 |
| 2021 | 30.6 | 25.7 | 11.2 |
| 2022 | 44.3 | 34.6 | 19.8 |
| 2023 | 46.7 | 32.2 | 15.2 |
| 2024 | 41.4 | 29.1 | 17.5 |
(Source: The Insolvency Service)Note: Data for Northern Ireland are only available for 2019-24.
Conversely, 2020 proved to be the lowest CVL rate across all UK nations, at:
- 24.4 per 10,000 companies (England and Wales)
- 13.3 per 10,000 businesses (Scotland)
- 9.7 per 10,000 corporations (Northern Ireland)
Did you know?
If your business is solvent, but you're ready to wind up your company for retirement, restructuring, or to pursue another business venture, then a Members' Voluntary Liquidation (MVL) might be an option for you.
This process of solvent liquidation is a tax-efficient, cost-effective way to liquidate your assets and set you up for the next chapter of your life.
You can only consider solvent liquidation if your company:
- Has been trading for at least 24 months
- Has at least -25,000 net assets after all debts and costs are settled
- Is solvent and not facing the threat of insolvency
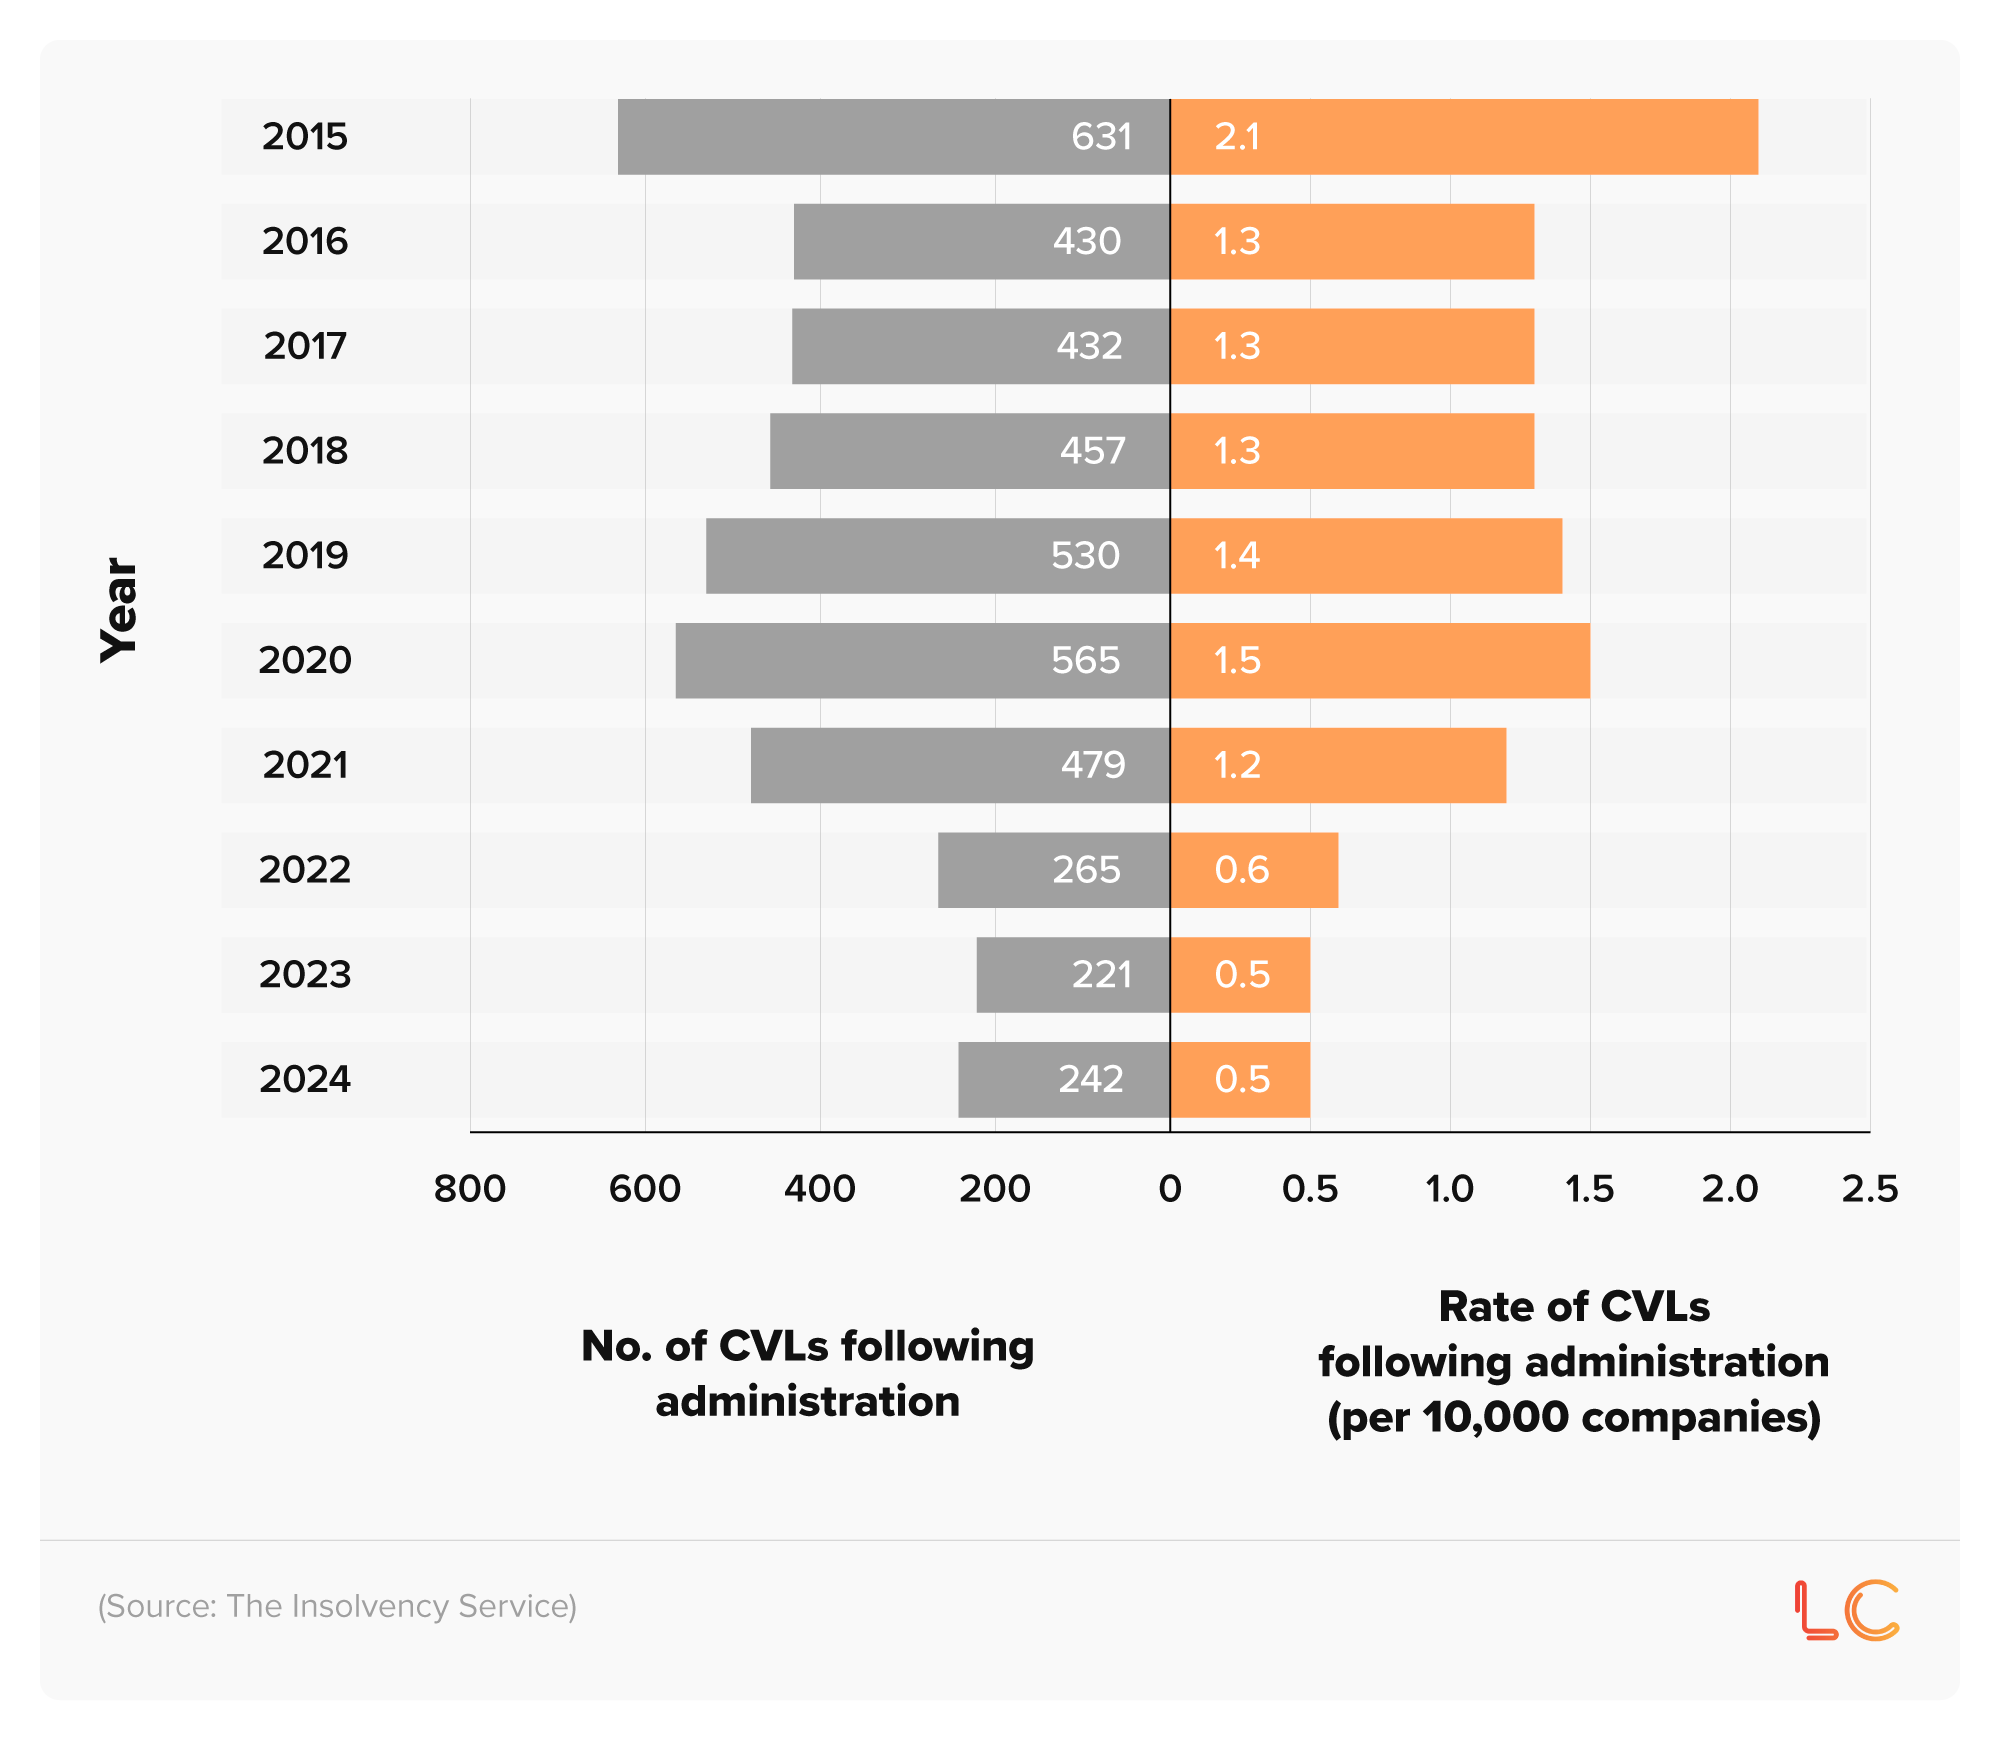
UK CVL statistics following administration
The number of CVLs following administration in England and Wales has generally decreased over time, from a peak of 631 in 2015 to a low of 221 in 2023. This is a 65% decrease in less than 10 years.
The number and rate of CVLs following administration in England and Wales over time (2015-24)
UK Company Voluntary Arrangement (CVAs) statistics
UK CVA statistics over time
As of 2024, the number of CVAs in the UK stood at 222. Around nine in 10 of these (91%) were based in England and Wales.
Number of CVAs in the UK over time (2015-24)
Over time, the number of UK CVAs has generally decreased, from 377 in 2015 down to a low of 122 in 2021. This represents a fall of more than two-thirds (67.6%) in six years.
UK CVA rate statistics, per 10,000
Historically, the UK's CVA rate has been highest in Northern Ireland, ranging from 0.6 per 10,000 companies in 2021, down from 3.4 per 10,000 in 2020.
CVA rate in the UK over time (2015-24)
| Year | England and Wales | Scotland | Northern Ireland |
|---|---|---|---|
| 2015 | 1.2 | 0.3 | - |
| 2016 | 1.1 | 0.7 | - |
| 2017 | 0.9 | 0.2 | - |
| 2018 | 1.0 | 0.3 | - |
| 2019 | 1.0 | 0.0 | 2.9 |
| 2020 | 0.7 | 0.3 | 3.4 |
| 2021 | 0.3 | 0.1 | 0.6 |
| 2022 | 0.3 | 0.1 | 1.6 |
| 2023 | 0.4 | 0.1 | 2.6 |
| 2024 | 0.4 | 0.0 | 2.3 |
(Source: The Insolvency Service)Note: Data for Northern Ireland are only available for 2019-24.
Conversely, the CVA for England and Wales only just exceeded 1.0 per 10,000 in 2015 and 2016 and has remained below this figure since 2020.
Scotland's CVA rate, on the other hand, rarely exceeded 0.3 per 10,000 companies between 2015 and 2024. The only time this happened during this period was in 2016 (0.7 CVAs per 10,000 companies).
UK receivership appointment statistics
UK receivership appointment statistics over time
As of 2024, six receivership appointments had been recorded across the UK. This was around two-thirds fewer than the reported figure for 2015 (19).
Number of receivership appointments in the UK over time (2015-24)
| Year | England and Wales | Scotland | Northern Ireland | UK |
|---|---|---|---|---|
| 2015 | 12 | 7 | - | 19 |
| 2016 | 5 | 5 | - | 10 |
| 2017 | 2 | 5 | - | 7 |
| 2018 | 1 | 5 | - | 6 |
| 2019 | 1 | 2 | 0 | 3 |
| 2020 | 3 | 1 | 1 | 5 |
| 2021 | 1 | 0 | 0 | 1 |
| 2022 | 1 | 0 | 1 | 2 |
| 2023 | 2 | 1 | 0 | 3 |
| 2024 | 3 | 3 | 0 | 6 |
(Source: The Liquidation Centre via The Insolvency Service)Note: Data for Northern Ireland are available only for 2019-24; therefore, the total UK figures for 2015-18 represent only those for England, Wales, and Scotland.
Between 2015 and 2024, there were 62 receivership appointments across the UK. Exactly half of these were based in England and Wales, with just under half (46.8%) from companies in Scotland.
UK company administration statistics
UK company administration statistics over time
In 2024, there were 1,675 company administrations in the UK. More than 95% of these were from businesses based in England and Wales.
Number of company administrations in the UK over time (2015-24)
The number of UK company administrations fluctuated between 2015 and 2024, reaching a low of 843 in 2021 and a high of 1,918 in 2019.
Since 2021, this figure has increased year-on-year and almost doubled over the past three years.
UK company administration rate statistics
The UK's company administration rate fluctuated between 2015 and 2024, reaching a low of 0.9 per 10,000 companies in Northern Ireland in 2021. This year also reported the lowest figures for England, Wales, and Scotland during this period (all 1.9 per 10,000).
Company administration rate in the UK over time, per 10,000 (2015-24)
| Year | England and Wales | Scotland | Northern Ireland |
|---|---|---|---|
| 2015 | 4.6 | 6.2 | - |
| 2016 | 4.1 | 8.0 | - |
| 2017 | 3.8 | 4.5 | - |
| 2018 | 4.1 | 3.8 | - |
| 2019 | 4.9 | 4.0 | 3.5 |
| 2020 | 3.9 | 3.5 | 1.8 |
| 2021 | 1.9 | 1.9 | 0.9 |
| 2022 | 2.9 | 2.2 | 2.3 |
| 2023 | 3.6 | 2.3 | 1.6 |
| 2024 | 3.5 | 2.6 | 2.0 |
(Source: The Insolvency Service)Note: Data for Northern Ireland are only available for 2019-24.
The highest rate of company administrations across the UK was in Scotland (2016), at 8.0 per 10,000 businesses.
By contrast, the highest reported figure for England and Wales was in 2019 at 4.9 company administrations per 10,000 corporations.
UK moratorium and restructuring plan statistics
UK moratorium and restructuring plan statistics over time
The number of business moratoriums across England and Wales reached a peak of 25 in 2022. This was about six times the lowest figure recorded in 2020 (4) and more than double the number for 2024.
Number of company moratoriums and restructuring plans in England and Wales over time (2015-24)
| Year | No. of moratoriums | No. of restructuring plans |
|---|---|---|
| 2020 | 4 | 2 |
| 2021 | 11 | 8 |
| 2022 | 25 | 2 |
| 2023 | 9 | 14 |
| 2024 | 10 | 9 |
(Source: The Insolvency Service)
By contrast, 14 company restructuring plans were registered in 2023, the only year to report double-digit figures during 2020-24.
Business failure statistics FAQs
How many businesses fail?
According to recent statistics from the IDBR, 296,880 UK companies shut down in 2024, with 220,490 shutting down in the year leading up to Q3 2025.
What percentage of businesses fail?
On average:
- 6.6% of UK businesses fail after the first year
- 31.5% fail after their second year
- 46.5% fail after the third year
- 56% fail after their fourth year
- 61.6% fail after five years
What percentage of startups fail?
In 2024, less than half (46%) of UK insolvencies were attributed to startup companies.
However, in terms of raw numbers, 316,025 new businesses were started in the UK in 2023. By 2024, 20,885 of these had folded, resulting in a startup failure rate of 6.6%.
How many startups fail in the UK?
In 2024, the number of failed startups stood at 20,885.
How many businesses fail in the first two years?
In 2022, 336,925 businesses were newly registered in the UK. By 2024, 104,800 of these had ceased to exist, resulting in a 31.5% startup failure rate after two years in operation.
How many businesses fail in the first three years?
In 2021, there were 363,995 startups in the UK. By 2024, 169,310 of these were no longer in operation. This means that just under half (46.5%) of UK startups from 2021 did not survive past their third year.
How many businesses fail in the first four years?
There were 333,015 UK startups registered in 2020. By 2024, 186,600 of these had shut down, resulting in a 56% startup failure rate after four years.
How many businesses fail in the first five years?
Of the 363,825 startups in the UK from 2019, more than three-fifths (61.6%) had failed by 2024. This means 223,980 of the new businesses born in 2019 lasted less than five years.
Sources and methodology
- https://commonslibrary.parliament.uk/research-briefings/sn06152/
- https://www.ons.gov.uk/download/table?format=csv&uri=/businessindustryandtrade/business/activitysizeandlocation/bulletins/businessdemography/2024/517c1bdf.json
- https://www.pwc.co.uk/press-room/press-releases/research-commentary/2025/pwc-analysis-finds-failure-rates-amongst-startups-at-lowest-leve.html
- https://www.ons.gov.uk/file?uri=/businessindustryandtrade/business/activitysizeandlocation/datasets/businessdemographyreferencetable/current/businessdemographyexceltables2024.xlsx
- https://static1.squarespace.com/static/64dcaa8b96fc07122c799a2f/t/6853feb0b58fc2086c3a9f4a/1750335179245/FB_RF_stateofthenation_2025_web_04.pdf
- https://www.step.org/press-office/family-businesses-risk-increased-taxes-family-and-business-breakdown-due-lack
- https://www.pwc.com/gx/en/issues/business-model-reinvention/family-business-survey.html
- https://www.gov.uk/government/statistics/small-business-survey-2024-businesses-with-employees
- https://assets.publishing.service.gov.uk/media/68c695d4d65a1a2a5172aaa6/LSBS_2024_Businesses_with_employees_cohort_B_data_tables_V1.xlsx
- https://www.ons.gov.uk/economy/economicoutputandproductivity/output/datasets/businessinsightsandimpactontheukeconomy
- https://assets.publishing.service.gov.uk/media/69442a229273c48f554cf62c/Data_Tables_in_Excel__xlsx__Format_-_Company_Insolvency_Statistics_November_2025.xlsx
Methodology
Startup failure rate statistics
ONS figures were taken from each of the devolved nations (England and Wales, Scotland, and Northern Ireland) for the number and percentage of startups that failed after one, two, three, four, and five years, by region and industry, and were added together to find total figures for the UK.
UK town centre liquidation rates
Data was sourced from the Free Company Data product published by the UK government.
Since no direct data were available for UK high streets, an approximation was derived based on the business concentration (i.e., town centres) using the following criteria:
- A 50 m- grid was overlaid on each local authority in the geocoded data.
- For each grid point within a particular local authority, the number of registered businesses within a 500m radius was calculated.
- The points with the business density were sorted, and the point with the highest number of businesses within a 500m radius was taken as the town centre.
- These town centres were then spatially joined to all registered businesses to obtain the number of high street businesses in each area.
The business liquidation rate was calculated as the number of businesses with any of the following tags (in administration, administrative receiver, voluntary arrangement/administrative receiver, liquidation, in administration/administrative receiver, or administration order) divided by the total number of businesses in the area.
Notes:
- The main dataset does not include exact liquidation dates or the dates when company liquidation claims were raised. The liquidation date was approximated using the 'ConfStmtNextDueDate' field for companies with a liquidation status. While not exact, this provides a reasonable estimate.
- Town centres were filtered to include only those with at least 1,500 businesses within a 50m radius.
UK business insolvency statistics over time
Where possible, ONS data was taken from each of the devolved nations (England and Wales, Scotland, and Northern Ireland) for the number of:
- Company insolvencies (by year and industry)
- Compulsory liquidations
- CVLs
- CVAs
- Receivership appointments
- Company administrations
- Moratorium and restructuring plans
This was added together to generate total values for the UK over time.
Data was also collected from various other sources (including ONS, PwC, and Gov.uk) to show the following statistics over time.
Where possible, this was broken down and analysed by region and industry to show the UK business failure rate and the percentage of businesses in the UK that fail.
In some cases, the data has been forecast using the exponential smoothing algorithm to see how current trends may evolve. This method is well-suited to this type of data, as it assigns more weight to recent observations and exponentially less weight to older observations. This allows the forecast to adapt quickly to evolving patterns, trends, and seasonality.
Sources used:
- https://www.pwc.co.uk/press-room/press-releases/research-commentary/2025/pwc-analysis-finds-failure-rates-amongst-startups-at-lowest-leve.html
- https://www.ons.gov.uk/businessindustryandtrade/business/activitysizeandlocation/bulletins/businessdemographyquarterlyexperimentalstatisticsuk/julytoseptember2025#business-closures
- https://www.ons.gov.uk/businessindustryandtrade/business/activitysizeandlocation/datasets/businessdemographyquarterlyexperimentalstatisticsuk
- https://www.ons.gov.uk/businessindustryandtrade/business/activitysizeandlocation/datasets/businessdemographyreferencetable
- https://www.ons.gov.uk/businessindustryandtrade/business/activitysizeandlocation/datasets/businessdemographyquarterlyexperimentalstatisticslowlevelgeographicbreakdownuk
- https://assets.publishing.service.gov.uk/media/69442a229273c48f554cf62c/Data_Tables_in_Excel__xlsx__Format_-_Company_Insolvency_Statistics_November_2025.xlsx